Kiri Industries Files Q3 FY26 Earnings Call Transcript Under SEBI Regulations


Kiri Industries submitted its Q3/9M-FY26 earnings conference call transcript under SEBI regulations, highlighting the landmark USD 689.03 million DyStar settlement received on December 31, 2025. The company reported ₹162 crores standalone revenue for Q3 FY26 with ₹58 crores EBITDA, while progressing on its integrated copper-fertilizer project with ₹12,000-13,000 crores CAPEX planned over FY27-FY28.

*this image is generated using AI for illustrative purposes only.
Kiri Industries Limited has submitted the transcript of its Q3/9M-FY26 earnings conference call held on February 11, 2026, in compliance with Regulation 30 of SEBI (Listing Obligations and Disclosure Requirements) Regulations, 2015. The transcript was filed on February 14, 2026, and is also available on the company's website at www.kiriindustries.com .
DyStar Settlement Milestone
During the earnings call, Chairman and Managing Director Manish Kiri announced the conclusion of the 11-year legal battle surrounding DyStar shareholding. On December 31, 2025, the Singapore court's Receiver remitted USD 689.03 million to the company, including USD 603.80 million towards share sale proceeds and additional amounts for legal costs and discretionary payments.
| Parameter | Details |
|---|---|
| Total Settlement Amount | USD 689.03 million |
| Share Sale Proceeds | USD 603.80 million |
| INR Equivalent | Approximately ₹5,854 crores |
| Settlement Date | December 31, 2025 |
Financial Performance Highlights
The company reported mixed operational performance for Q3 FY26. On a standalone basis, revenue from operations reached ₹162 crores, registering 3% year-on-year growth. EBITDA stood at ₹58 crores, supported by dividend income and legal cost reimbursements. For the nine-month period, standalone revenue grew 14% to ₹537 crores with EBITDA of ₹65 crores.
| Metric | Q3 FY26 | Nine Months FY26 |
|---|---|---|
| Standalone Revenue | ₹162 crores (+3% YoY) | ₹537 crores (+14% YoY) |
| Standalone EBITDA | ₹58 crores | ₹65 crores |
| Consolidated Revenue | ₹174 crores | ₹589 crores (+10% YoY) |
| Consolidated EBITDA | ₹53 crores | ₹59 crores |
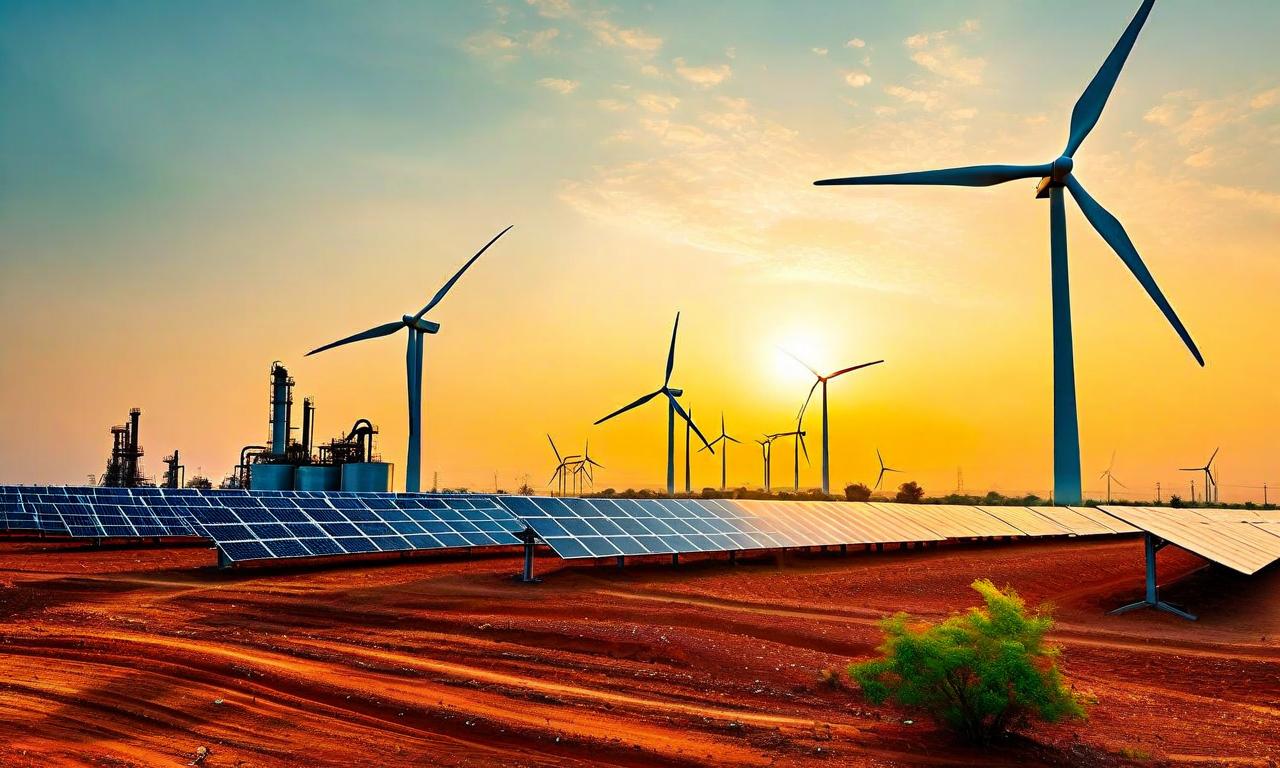
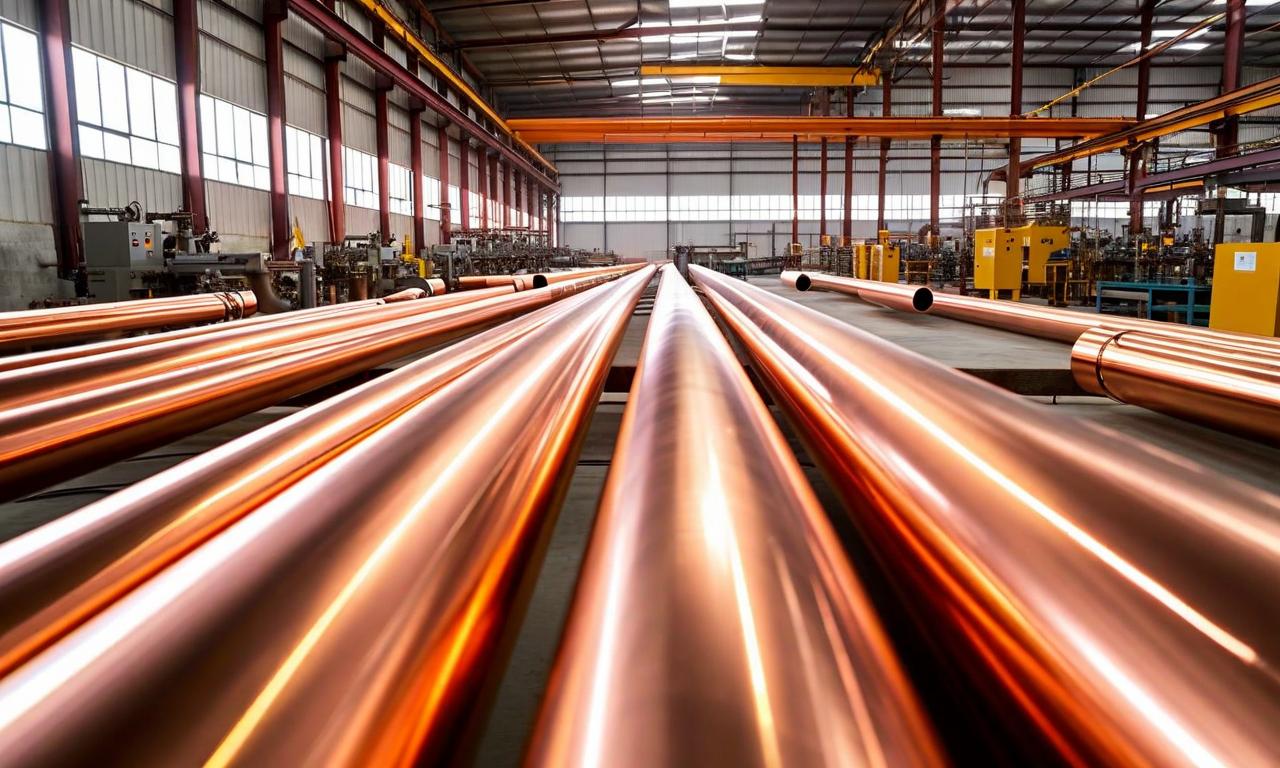
Copper and Fertilizer Project Progress
The integrated copper and fertilizer project execution is progressing as planned. Key approvals including environmental clearances have been received, and land acquisition is substantially completed. Site development activities including boundary walls, fencing, and initial civil works are underway. Major equipment orders for rod and tube plants have been placed with advance payments released.
| Project Component | Timeline | Expected Revenue |
|---|---|---|
| First Phase Operations | April 2027 | ₹20,000-25,000 crores |
| Fertilizer Operations | September-December 2028 | Part of integrated facility |
| CAPEX Investment | FY27-FY28 | ₹12,000-13,000 crores |
| Expected EBITDA (FY28) | 2027-28 | ₹1,200-1,500 crores |
Strategic Focus and Fund Deployment
Management emphasized that the DyStar proceeds will be deployed for long-term strategic initiatives rather than immediate dividend distribution. The board prioritizes investment in the copper-fertilizer project, which requires significant equity infusion and working capital support during execution. Tata Consulting Engineers Limited has been appointed as owner's engineers for detailed engineering and project execution oversight.
Raw material sourcing arrangements covering over 4.8 million tonnes per annum of copper concentrate capacity provide long-term supply visibility. The project aims to serve India's growing copper demand, which is expected to increase from current 1.8-2.0 million tonnes to at least 3 million tonnes by 2030.
Regulatory Compliance
The earnings call transcript submission demonstrates the company's commitment to transparency and regulatory compliance. Company Secretary Suresh Gondalia digitally signed the filing, ensuring proper authentication of the document. The transcript provides comprehensive insights into the company's financial performance, strategic direction, and management's outlook on future growth prospects.
Historical Stock Returns for Kiri Industries
| 1 Day | 5 Days | 1 Month | 6 Months | 1 Year | 5 Years |
|---|---|---|---|---|---|
| -0.58% | +3.47% | +0.77% | -25.64% | -26.99% | -34.65% |
 20
20