

VST Tillers Tractors reports 9.6% drop in July sales volume


VST Tillers Tractors reported a 9.6% year-on-year drop in July 2026 sales to 5,853 units, down from 6,471 units in July 2025. However, year-to-date sales grew 7.7% to 20,914 units, indicating that earlier months compensated for the July decline. Power tiller sales fell 9.6% in July but rose 8.6% cumulatively.


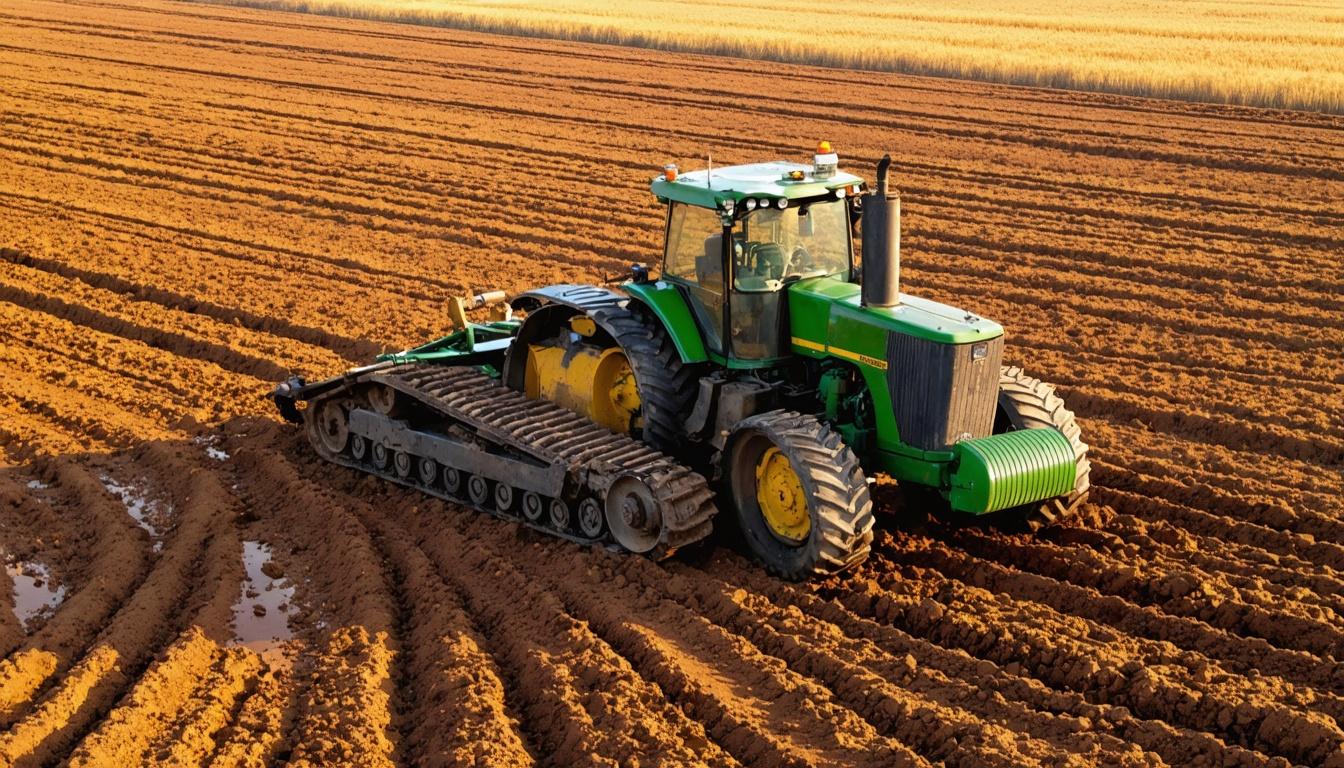
*this image is generated using AI for illustrative purposes only.
VST Tillers Tractors reported a 9.6% year-on-year decline in total sales quantity for July 2026, signaling a slowdown in monthly demand despite strong year-to-date performance. The company sold 5,853 units in July 2026 compared to 6,471 units in July 2025. This monthly contraction contrasts with an overall positive trend for the fiscal period, as cumulative sales from April to July rose 7.7% to 20,914 units from 19,426 units in the corresponding period of FY25.
The filing was submitted to the National Stock Exchange of India Limited and BSE Limited on August 01, 2026. Chinmaya Khatua, Company Secretary & Compliance Officer, signed the disclosure. The figures provided are unaudited and subject to change upon final audit.
Sales Breakdown by Segment
The decline in July sales was broad-based, affecting both core product lines. Power tiller sales, which constitute the majority of the company’s volume, dropped by 576 units month-on-month relative to the prior year. Tractor sales also saw a reduction of 42 units.
| Particulars | July 2026 (Nos.) | YTD 2026 (Nos.) | July 2025 (Nos.) | YTD 2025 (Nos.) |
|---|---|---|---|---|
| Power Tiller | 5,450 | 19,251 | 6,026 | 17,727 |
| Tractor | 403 | 1,663 | 445 | 1,699 |
| Total | 5,853 | 20,914 | 6,471 | 19,426 |
Power tillers remained the dominant contributor to total volume, accounting for approximately 93% of total sales in July 2026. The year-to-date growth in power tiller sales was robust, with deliveries increasing by 1,524 units compared to the same period last year.
What the Numbers Show
The divergence between monthly and cumulative performance suggests that the July decline may be a seasonal fluctuation rather than a structural downturn. While July 2026 saw a contraction in both segments, the year-to-date figures indicate that VST Tillers has successfully offset this monthly dip with stronger performance in the preceding months of April, May, and June. The 7.7% growth in cumulative sales demonstrates resilience in the broader agricultural equipment market despite the single-month weakness.
Historical Stock Returns for VST Tillers Tractors
| 1 Day | 5 Days | 1 Month | 6 Months | 1 Year | 5 Years |
|---|---|---|---|---|---|
| +0.56% | -2.41% | +2.61% | -18.95% | -24.01% | +33.12% |

Will the seasonal dip in July sales persist into August and September, or is a rebound expected with the onset of the Kharif sowing season?
How might the recent decline in power tiller volumes impact VST Tillers' gross margins given the product's lower average selling price compared to tractors?
Is the company planning to adjust its production capacity or inventory levels in response to the month-on-month contraction in July?
 18
18








 Access Market Heat-map & Insights
  Create, Save & Share your Screener
  Use 200+ Screening Filters





