

Vardhman Textiles Q1FY27 EBITDA rises 33% to ₹528 crore on yarn demand


Vardhman Textiles delivered strong Q1FY27 results with standalone PAT rising 41% to ₹285 crore and EBITDA surging 33% to ₹528 crore. Yarn sales drove growth, while the company announced ₹3,660 crore in capex for capacity expansion in yarn and garments.

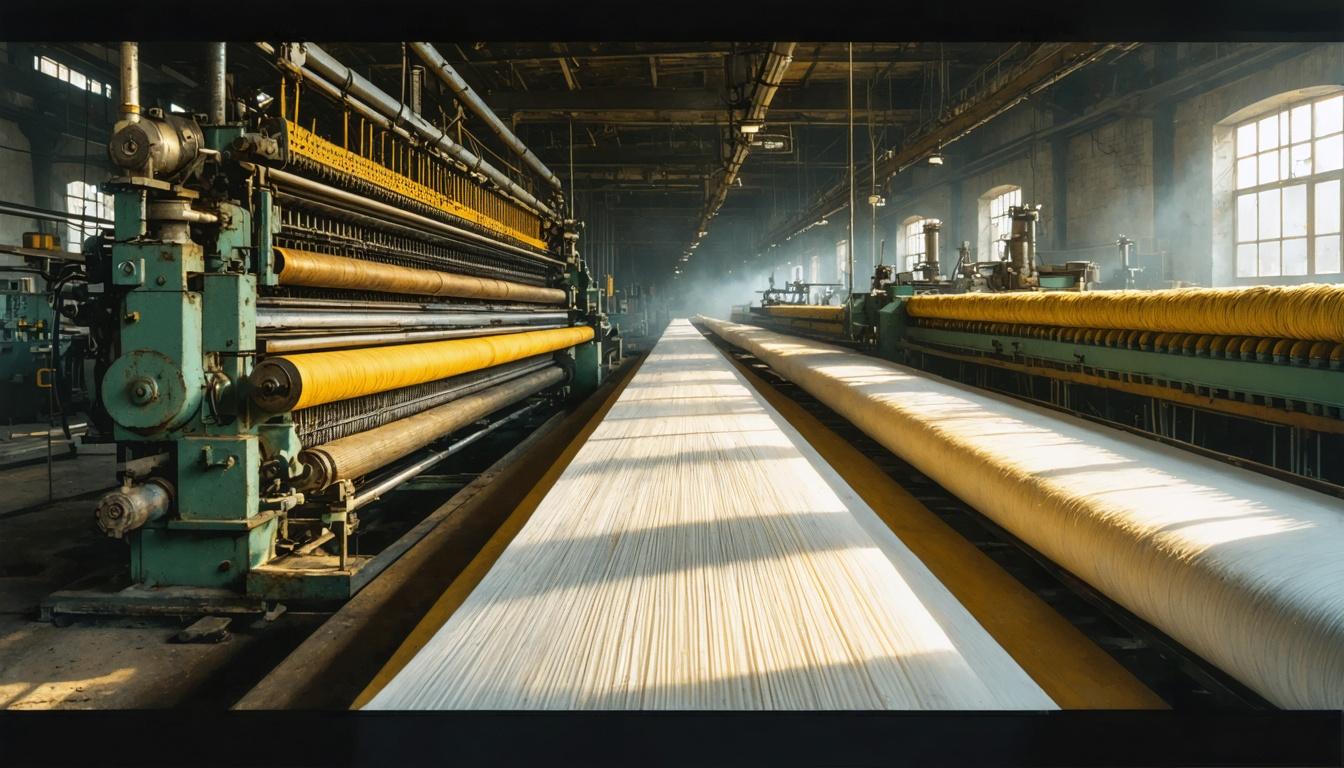

*this image is generated using AI for illustrative purposes only.
Vardhman Textiles reported a robust start to FY27, with standalone earnings per share (EPS) rising 41% to ₹9.85 for Q1FY27. The growth was primarily driven by a 33% year-on-year surge in total EBITDA to ₹528 crore, expanding margins by 295 basis points to 19.4%. Standalone revenue from operations increased 13% to ₹2,648 crore, reflecting strong demand in its core yarn segment and improved operational efficiency across its vertically integrated textile manufacturing units.
The Board of Directors approved the unaudited financial results on July 30, 2026. Statutory auditors Deloitte Haskins & Sells LLP reviewed the results under Regulation 33 of the SEBI (Listing Obligations and Disclosure Requirements) Regulations, 2015. The company’s consolidated net profit for the quarter stood at ₹310 crore, up from ₹207 crore in Q1FY26.
Standalone Financial Performance
Vardhman Textiles’ standalone results highlight significant margin expansion despite moderate top-line growth. Profit before tax (PBT) jumped 43% to ₹380 crore, while net profit after tax (PAT) reached ₹285 crore, compared to ₹202 crore in the corresponding quarter of FY26. Total income rose 13% to ₹2,721 crore, supported by other income of ₹73 crore.
| Metric | Q1FY27 | Q1FY26 | YoY Change |
|---|---|---|---|
| Revenue from Operations | ₹2,648 crore | ₹2,342 crore | +13% |
| Total EBITDA | ₹528 crore | ₹397 crore | +33% |
| EBITDA Margin | 19.4% | 16.5% | +295 Bps |
| Net Profit After Tax | ₹285 crore | ₹202 crore | +41% |
| EPS (Basic) | ₹9.85 | ₹6.97 | +41% |
Operational Highlights
Operational data reveals divergent trends across product segments. Yarn sales volume increased 7.2% year-on-year to 70,052 MT, with production rising 2.0% to 70,046 MT. This growth in yarn, which constitutes 69.0% of total revenue in Q1FY27 (up from 65.0% in FY26), was the primary driver of profitability. Conversely, grey fabric production declined 6.9% to 462 lakh meters, and processed fabric production fell marginally by 0.5% to 408 lakh meters. Geographically, domestic sales accounted for 53.0% of revenue, while exports contributed 47.0%.
Capital Expenditure and Expansion Plans
The company disclosed a total announced capital expenditure of ₹3,660 crore. Key initiatives include:
- Yarn Capacity: Completion of an expansion of approximately 17,000 spindles, with an open-end project targeted for completion by FY2027-28.
- Garments Unit: Board approval to expand garment capacity from 2.2 million to 4.5 million shirts per annum, involving an investment of approximately ₹125 crore, expected to complete by end-FY2026-27.
- Processed Fabric: Commercial production started at new units in March 2026, adding 31 million meters annually.
What the Numbers Show
The divergence between flat-to-negative volume growth in fabric segments and strong profit expansion underscores Vardhman Textiles’ successful shift towards higher-margin yarn products. With EBITDA margins expanding to 19.4% from 16.5%, the company is effectively leveraging its scale in yarn production. The strategic capex focus on garments and further yarn capacity indicates a long-term bet on vertical integration to capture more value from end-consumer markets, potentially stabilizing revenue streams against volatility in raw fabric demand.
Historical Stock Returns for Vardhman Textiles
| 1 Day | 5 Days | 1 Month | 6 Months | 1 Year | 5 Years |
|---|---|---|---|---|---|
| -1.00% | -5.74% | -10.71% | +1.06% | +28.19% | +42.86% |

How will the upcoming completion of the open-end yarn project in FY2027-28 impact Vardhman's cost structure and competitive positioning in the global yarn market?
Given the decline in grey and processed fabric volumes, what specific strategies is management deploying to reverse this trend or mitigate the risk of over-reliance on the yarn segment?
With garment capacity set to double by end-FY2026-27, how does Vardhman plan to secure long-term contracts with international retail buyers to ensure utilization of this new capacity?
 19
19








 Create Custom Screeners
  Access 200+ Pre-built Filters
  Use 50+ Readymade Screener





