

US Retailers Battle Fuel Costs: Walmart Expects $2 Billion Hit


- Walmart Inc. expects more than $2 billion in incremental fuel-related expenses for the fiscal year
- Best Buy Co. reported computing average selling prices rose in the mid-teens while unit volumes fell by a high-single-digit percentage
- Most retailers, including Target and Dollar General, raised their financial outlooks despite cost pressures
- Costco Wholesale Corporation reported overall inflation in the low single digits during its fiscal fourth quarter

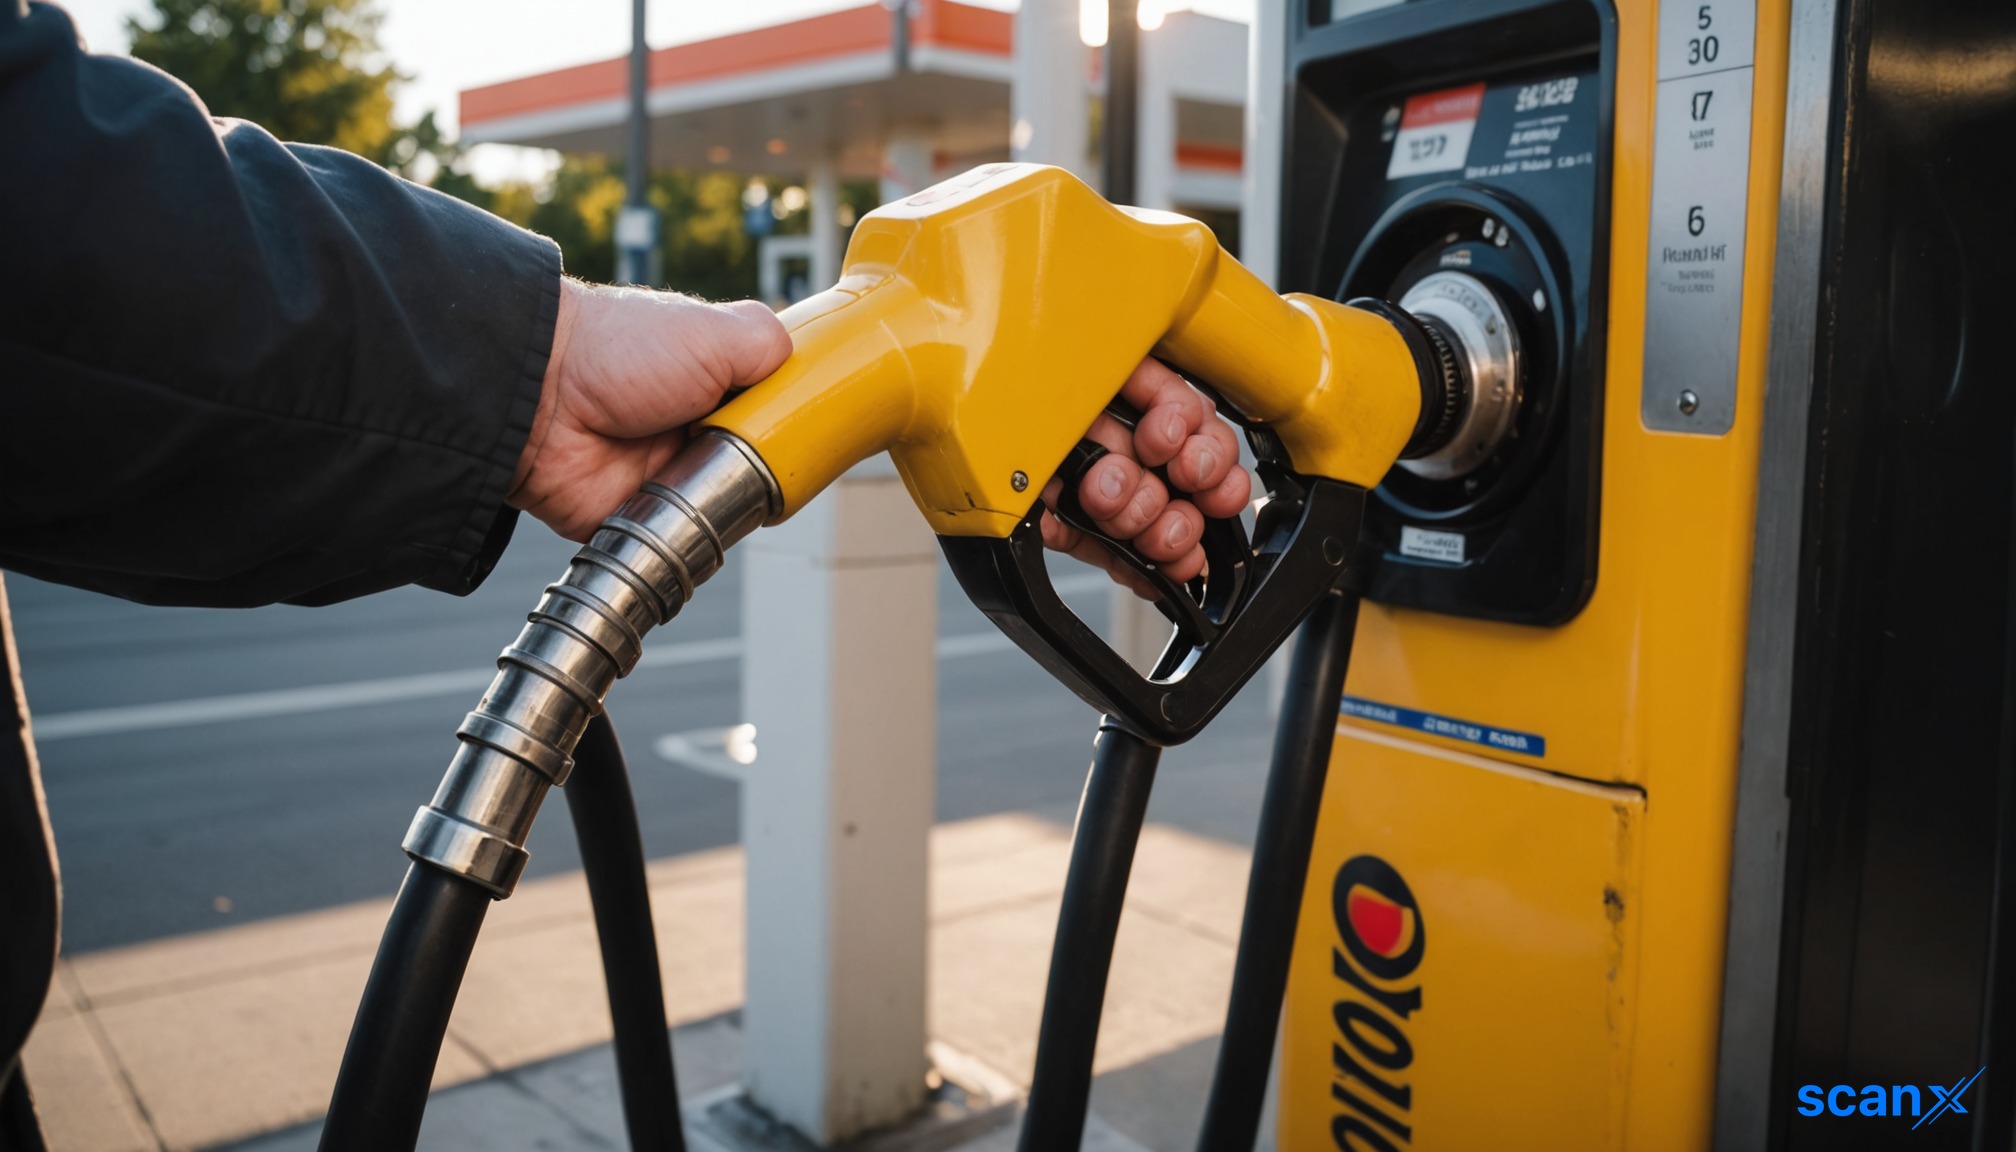

*this image is generated using AI for illustrative purposes only.
Major US retailers are navigating an uneven inflation environment, with higher fuel, transportation, and supplier costs pressuring operating margins. Walmart Inc. expects more than $2 billion in incremental fuel-related expenses for the fiscal year, exceeding original guidance assumptions.
Despite these headwinds, most retailers have raised their financial outlooks. Strategies vary, with some firms passing costs to consumers while others reinvest tariff refunds to maintain price competitiveness.
Fuel and Freight Costs Keep Pressure on Retail Margins
Several major retailers cited higher fuel, freight, or transportation costs as an ongoing pressure. John David Rainey, CFO of Walmart Inc., said the company expects more than $2 billion in incremental fuel-related expenses during the fiscal year, assuming fuel prices remain near current levels.
Ross Stores expects domestic freight to remain a margin headwind in the second half. The TJX Companies anticipates higher fuel and freight rates, with additional pressures from trucking capacity and driver unavailability. David Kennerley, CFO of Kroger, noted assumptions of incremental headwinds from diesel and freight costs through the balance of the year. Williams-Sonoma's second-half guidance also assumes high fuel prices close to prevailing levels.
Product Inflation Remains Uneven Across Categories
Costco Wholesale Corporation reported overall inflation in the low single digits during its fiscal fourth quarter. The company experienced non-food inflation, particularly in consumer electronics due to memory costs, as well as gasoline and petroleum-related products. Costco mentioned a relatively stable inflation environment with significant uncertainty on the outlook.
Best Buy Co. said computing average selling prices rose in the mid-teens during the second quarter, while unit volumes fell by a high-single-digit percentage. Management indicated similar pricing dynamics could continue through the rest of the year. Ross Stores expects average unit retail prices to increase by a low-single-digit percentage during the second half of 2026. Jim Conroy, CEO of Ross Stores, stated that modest AUR increases at current levels are likely. Kroger highlighted that overall food inflation was modestly higher in the second quarter than in the first quarter.
Retailers Lean on Value, Tariff Refunds and Cost Savings
Retailers including Walmart, Dollar General Corporation, and Kroger reinvested tariff benefits into customer value. Target Corporation continued to emphasize lower prices, while TJX highlighted its value positioning as it managed tariff and freight costs. Target emphasized that value would remain a central part of its strategy as consumers remain selective about discretionary spending. In September, the company slashed prices on nearly 2,000 products, building on more than 10,000 price cuts made over the past year.
Walmart is reinvesting tariff refunds into customer value and pricing initiatives, with the financial impact expected to be largely contained within FY27. Dollar General leveraged a substantial portion of tariff refunds to fund targeted promotions and lower everyday prices.
Most Retailers Maintain a Positive Growth Outlook
The majority of retailers raised their financial outlook, reflecting expectations for continued growth. Dollar General, Ross Stores, and Home Depot are continuing to open new locations, while Williams-Sonoma expects store-count growth of 1% to 3% annually beginning in FY27.
| Company | Fiscal Year | Guidance Status | Full-Year Sales / Comparable Sales Outlook | Other Full-Year Quantitative Guidance |
|---|---|---|---|---|
| Walmart Inc. | FY27 | Raised | Net sales growth 4% to 5% | Adjusted operating income growth 7% to 8.5%; adjusted EPS $2.80 to $2.87; Capex nearly 4% of annual net sales |
| Costco Wholesale Corp | FY27 | Not Provided | Not Provided | Planned Capex of $7.5B in FY27; targeting run rate of 30 net new warehouses annually |
| Home Depot Inc. | FY26 | Reaffirmed | Total sales growth 2.5% to 4.5%; comparable sales 0% to 2% | Adjusted operating margin 12.8% to 13.0%; adjusted EPS growth 0% to 4%; Capex nearly 2.5% of sales |
| TJX Companies Inc. | FY27 | Comparable maintained; Profit raised | Consolidated sales $63.4B to $63.8B; comparable sales growth 3% to 4% | Adjusted gross margin 31.2% to 31.3%; adjusted EPS $5.15 to $5.20 |
| Lowe's Companies Inc. | FY26 | Lowered to bottom of range | Sales about $92B; comparable sales approximately flat | Adjusted operating margin nearly 11.6%; adjusted EPS approximately $12.25; Capex up to $2.5B |
| Ross Stores Inc. | FY26 | Raised Q3/Q4 outlook | Q3 Comparable sales growth +6% to 7%, Q4 comparable sales growth 4% to 5% | Full-year EPS $8.61 to $8.77 |
| Target Corporation | FY26 | Raised | Net sales growth approximately 5% | Operating margin around 6.0%; EPS $9.90 to $10.90; Capex nearly $5B |
| Kroger Company | FY26 | Sales lowered; profit reaffirmed | Comparable sales excluding fuel 0.2%–0.8%, previously 1%–2% | Adjusted FIFO operating profit $5.0B to $5.2B; EPS $5.10 to $5.30 (maintained) |
| Williams-Sonoma Inc. | FY26 | Raised | Total net revenue growth 4.7% to 7.2%; Comparable sales growth 4.0% to 6.5% | Adjusted operating margin 17.8% to 18.2%; Capex nearly $275M |
| Dollar General Corp | FY26 | Raised | Net sales growth 4.0% to 4.3%; same-store sales growth 2.5% to 2.9% | EPS $7.80 to $8.00 |
| Ulta Beauty Inc. | FY26 | Raised | Net sales growth 6.7% to 7.2%; comparable sales growth 3.2% to 3.7% | Operating profit growth 8.3% to 9.3%; diluted EPS $28.70 to $29.00; Capital expenditures of $400 million to $450 million |
| Best Buy Co. Inc. | FY27 | Raised | Revenue $42.3B to $42.8B; comparable sales growth 1.9% to 3.0% | Adjusted operating income rate 4.4% to 4.5%; adjusted EPS $6.70 to $6.90; CapEx nearly $750M |
What the Numbers Show
A divergence exists between volume-driven and price-driven growth strategies among retailers. Best Buy Co. reported computing average selling prices rising in the mid-teens while unit volumes fell by a high-single-digit percentage, indicating revenue stability is being maintained through price increases rather than demand strength. Conversely, Ulta Beauty projects net sales growth of 6.7% to 7.2% alongside comparable sales growth of 3.2% to 3.7%, suggesting a healthier mix of traffic and basket size expansion.

How might sustained high fuel costs and trucking capacity constraints impact retail supply chain logistics and inventory levels in the upcoming quarters?
Will the reinvestment of tariff refunds into price cuts prove sufficient to offset margin erosion from rising freight expenses, or will retailers eventually need to raise prices again?
What are the long-term implications for Best Buy's market share if it continues to rely on price increases rather than volume growth to sustain revenue?













 Access Market Heat-map & Insights
  Create, Save & Share your Screener
  Use 200+ Screening Filters





