

Styrenix posts 166% profit surge in Q1FY27 despite volume dip


Styrenix Performance Materials reported a 166% YoY profit surge in Q1FY27 to ₹138.3 crore, driven by significant EBITDA margin expansion despite a 26% volume dip. Consolidated revenue rose 7.1% to ₹1,014.2 crore. Management attributed the strong margins to pricing power amidst geopolitical volatility and raw material cost fluctuations. The company declared an interim dividend of ₹23 per share and reaffirmed its ABS capacity expansion timeline for FY27.

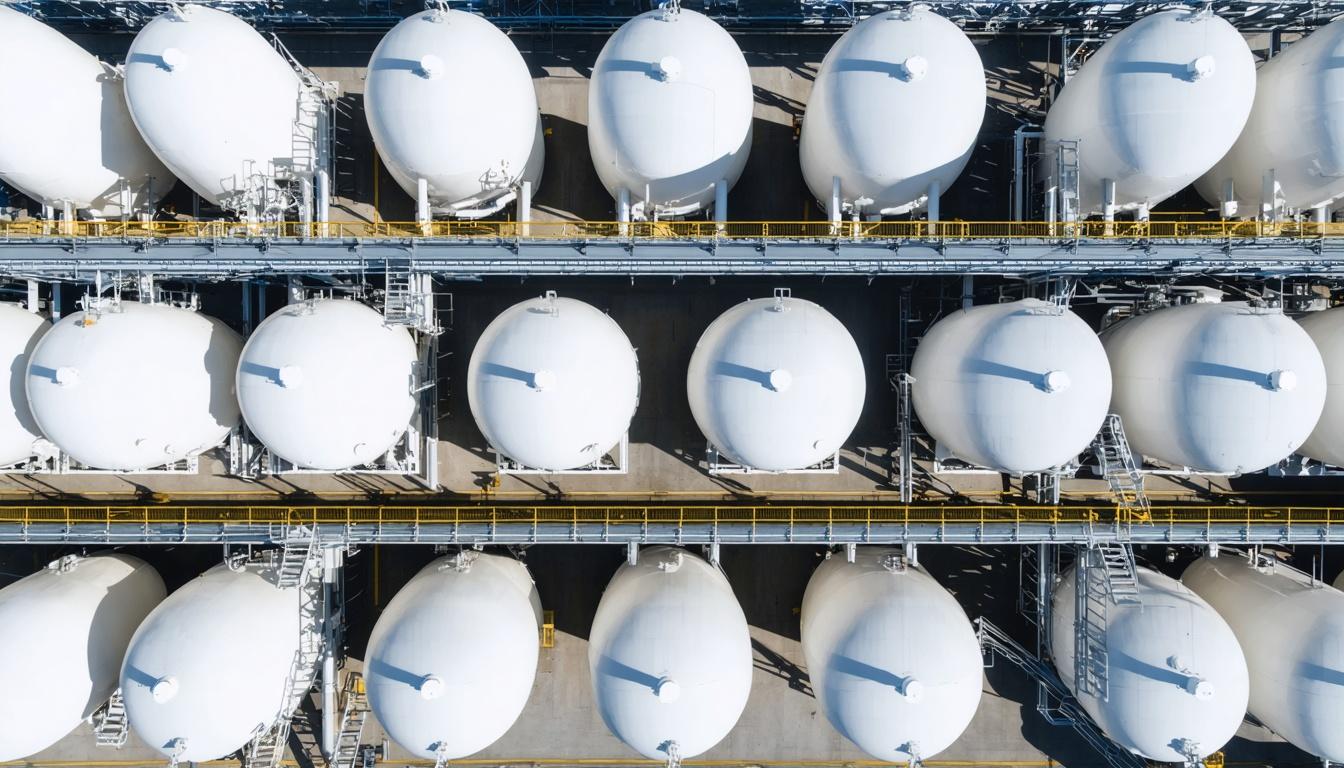

*this image is generated using AI for illustrative purposes only.
Styrenix Performance Materials delivered a robust set of financial results for the first quarter of FY27, with consolidated net profit surging to ₹138.30 crore compared to ₹51.92 crore in the corresponding period of the previous year. Revenue from operations rose to ₹1,014.19 crore from ₹946.88 crore year-on-year, reflecting steady top-line momentum in the engineering polymers segment. The Board of Directors, meeting on August 04, 2026, approved these unaudited standalone and consolidated financial results and declared an interim dividend of ₹23 per equity share for FY27. Shareholders holding shares on the record date of August 10, 2026, will be eligible to receive the payout, underscoring management's confidence in the company’s cash flow generation.
Q1FY27 Financial Performance
The company's performance highlights significant improvement in both revenue generation and profitability metrics. Consolidated EBITDA (Profit before Depreciation, Interest, and Tax) stood at ₹223.59 crore, a substantial increase from ₹99.84 crore in Q1FY26. This operational efficiency drove net profit margin expansion, with earnings per share (EPS) rising to ₹78.64 from ₹29.52 in the year-ago quarter. Managing Director Rahul R. Agrawal attributed the resilience to a strategy of diversifying sourcing, which helped navigate geopolitical disruptions around the Strait of Hormuz that caused volatility in energy and raw material prices.
| Metric | Q1FY27 (₹ Cr) | Q1FY26 (₹ Cr) | YoY Change |
|---|---|---|---|
| Revenue from Operations | 1,014.19 | 946.88 | +7.1% |
| Consolidated Net Profit | 138.30 | 51.92 | +166.4% |
| PBDIT (EBITDA) | 223.59 | 99.84 | +124.0% |
| EPS (Basic & Diluted) | ₹78.64 | ₹29.52 | +166.4% |
Standalone Results and Segment Details
On a standalone basis, Styrenix Performance Materials reported revenue of ₹768.04 crore, up from ₹721.11 crore in Q1FY26. The standalone net profit for the quarter was ₹137.32 crore, compared to ₹54.87 crore previously. The company operates in a single reportable business segment: "Engineering Polymers," as per IND AS 108. The financial results were prepared in accordance with Indian Accounting Standards (Ind AS) notified under Section 133 of the Companies Act, 2013.
The Board noted that the figures for the quarter ended March 31, 2026, are balancing figures between audited full-year figures and published year-to-date figures up to the third quarter. Statutory auditor Talati & Talati LLP expressed an unmodified conclusion on the results after conducting a limited review in accordance with Standard on Review Engagement (SRE) 2410.
Strategic Context and Capacity Expansion
Despite an extremely volatile operating environment, the company avoided declaring force majeure through close collaboration with suppliers and customers. Demand moderation was observed in the non-OEM segment due to temporary raw material price movements, but management expects recovery as input costs stabilize. Looking ahead, the first phase of ABS capacity augmentation (50,000 TPA) is progressing as scheduled and is expected to be commissioned during the current financial year. This expansion aims to strengthen the company’s ability to serve growing customer demand.
Dividend and Corporate Actions
Alongside the results, the Board declared an interim dividend of ₹23 per equity share of ₹10 each, representing a 230% payout on the face value. This declaration underscores the management's confidence in the company's cash flow generation and profitability trajectory. The record date for determining eligible members has been fixed as Monday, August 10, 2026. Investors holding shares prior to this date will receive the dividend payment.
What the Numbers Show
The sharp contrast between the 7.1% revenue growth and the massive surge in net profit indicates a significant margin expansion event rather than pure volume growth. With PBDIT more than doubling while revenue grew modestly, the company appears to have benefited from improved input cost dynamics or favorable product mix shifts within its engineering polymers portfolio. This operational leverage suggests that even moderate top-line increases can translate into disproportionate bottom-line gains, enhancing shareholder value through both retained earnings and the substantial interim dividend.
Volume Dynamics and Market Conditions
Despite the strong profitability metrics, consolidated sales volumes dipped 26% year-on-year to 50.8 KT, while standalone volumes fell to 38.9 KT. Management attributed this decline primarily to a cautious approach by buyers in the non-OEM and unorganized sectors amid heightened price volatility. Rahul R. Agrawal noted that while OEM demand remained relatively resilient, the non-OEM sector experienced more exaggerated impact due to uncertainty surrounding raw material costs and geopolitical disruptions in the Middle East.
Raw material prices exhibited significant volatility during the quarter. Styrene monomer prices fluctuated between $1,100 and $1,400 after peaking at $1,600-$1,700, while acrylonitrile ranged between $1,400 and $1,600 following peaks near $1,900. Butadiene prices also surged past $2,500 before moderating from earlier levels around $1,000. The company maintained higher inventory levels to mitigate supply chain risks, particularly for styrene monomer sourced from alternative suppliers due to disruptions in the Strait of Hormuz region.
Outlook and Capacity Expansion
Management emphasized that current margin levels reflect specific short-term events rather than sustainable long-term trends. They advised investors to assume margins will normalize to historical averages once geopolitical uncertainties subside. The company continues to focus on disciplined execution and operational resilience, with no changes to its strategic direction despite the volatile operating environment.
The ABS capacity expansion project remains on track for commissioning within FY27, although exact timing depends on safety and compliance considerations inherent in brownfield expansions. SAN merchant sales will continue unaffected by the expansion, with approximately 15,000 to 20,000 tonnes sold annually against a total capacity of 100,000 tonnes. The Thailand business continues to face challenges with lower utilization levels, but management remains committed to market development efforts across Southeast Asia.
Historical Stock Returns for Styrenix Performance Materials
| 1 Day | 5 Days | 1 Month | 6 Months | 1 Year | 5 Years |
|---|---|---|---|---|---|
| -2.09% | +0.96% | -2.01% | -7.02% | -14.47% | 0.0% |

How will the commissioning of the 50,000 TPA ABS capacity expansion in FY27 impact Styrenix's market share and competitive positioning in the engineering polymers segment?
What specific strategies is management implementing to stabilize margins once geopolitical disruptions in the Strait of Hormuz subside and raw material prices normalize?
How might the continued low utilization rates in the Thailand business affect the company's overall return on invested capital (ROIC) and long-term profitability in Southeast Asia?
 20
20










 Create Custom Screeners
  Access 200+ Pre-built Filters
  Use 50+ Readymade Screener





