

Stellant Securities FY26 Results: Net profit surges 1,558% to ₹213 crore


- Net profit surged to ₹2,130.71 lakh in FY26 from ₹129.11 lakh in FY25
- Revenue from operations jumped to ₹5,049.97 lakh, driven by securities trading
- Board recommends final dividend of ₹0.20 per equity share
- Total assets expanded to ₹8,184.70 lakh following capital raises
- Company commenced new bullion trading segment during the year



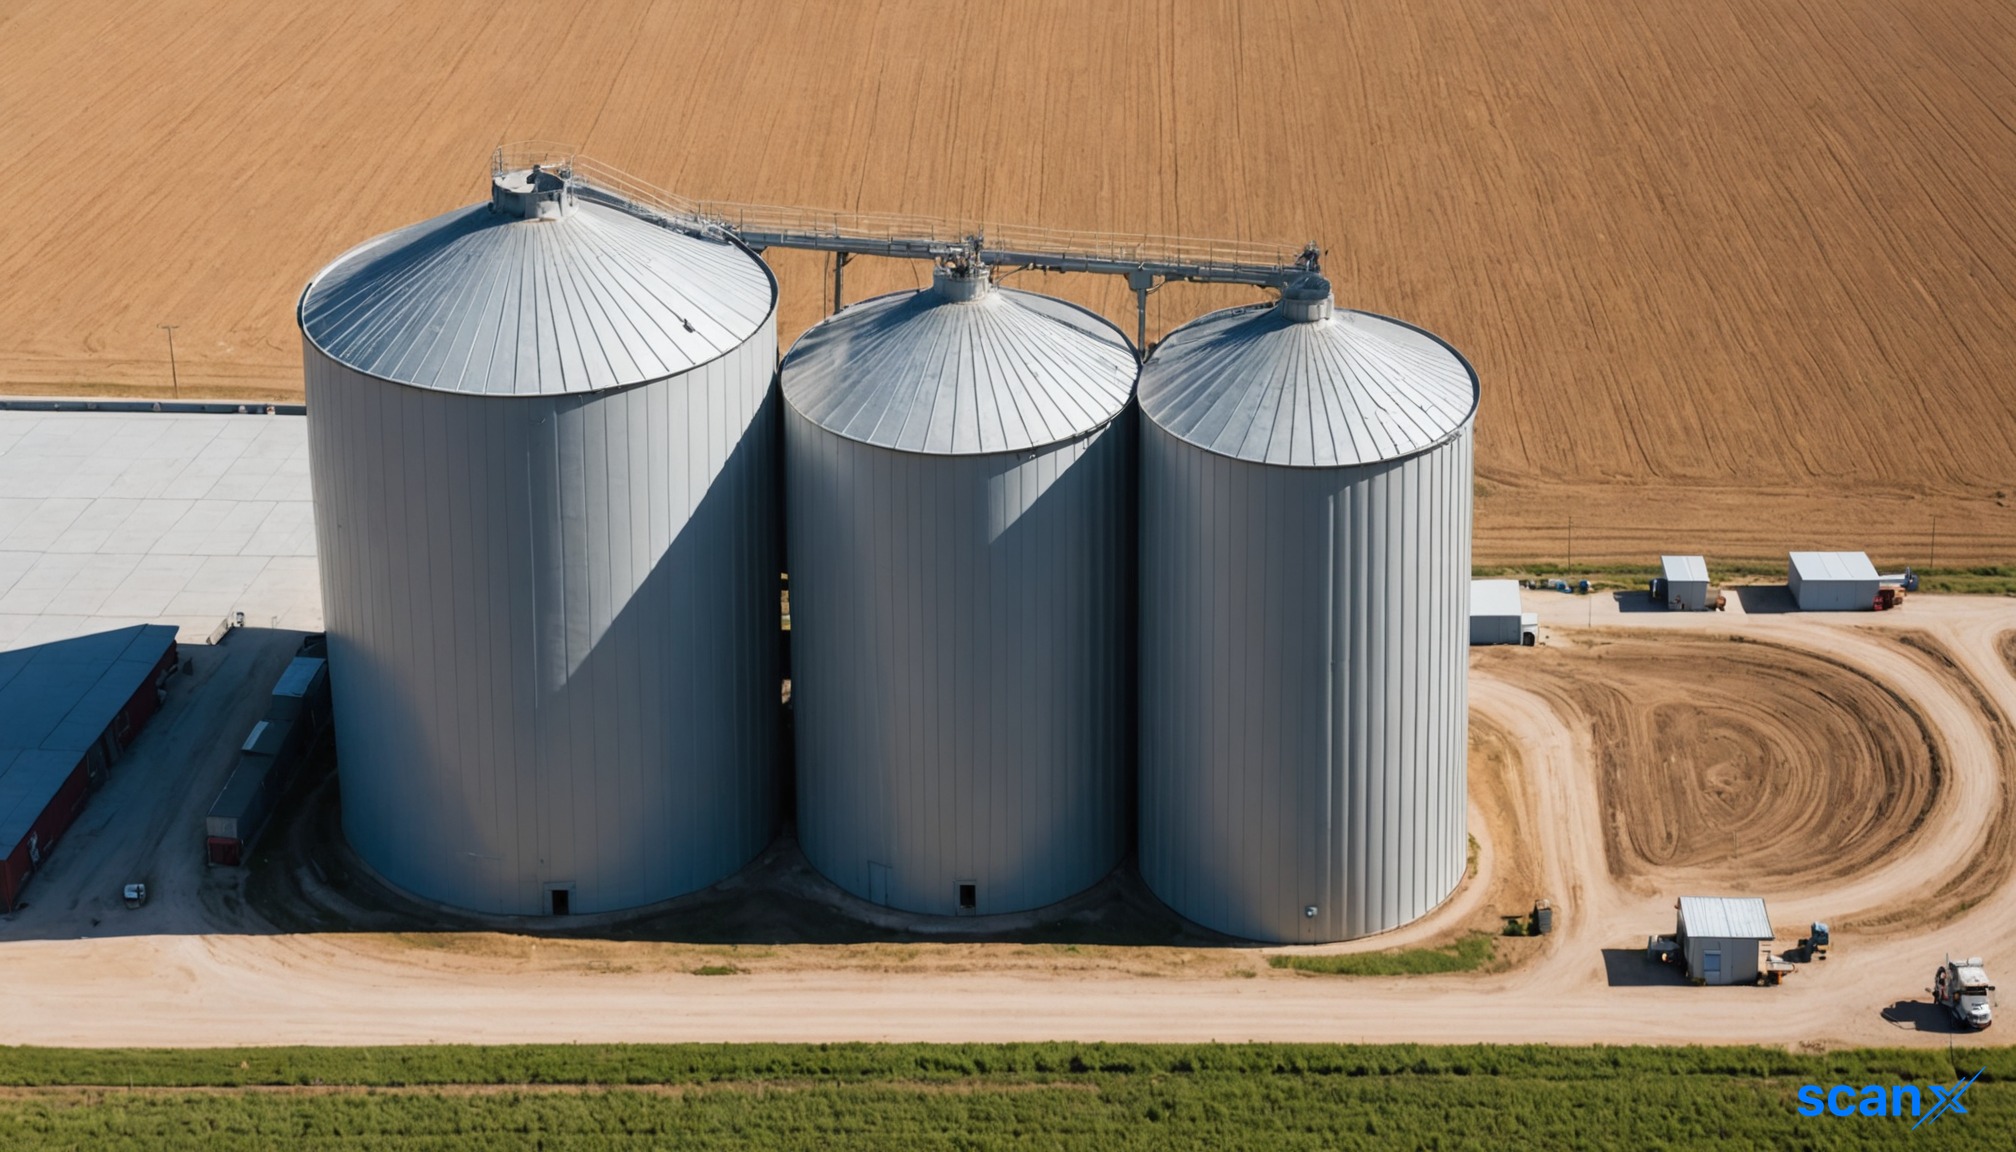
*this image is generated using AI for illustrative purposes only.
Stellant Securities reported a net profit of ₹2,130.71 lakh for the financial year ended March 31, 2026, marking a significant increase from ₹129.11 lakh in the previous year. Total revenue from operations stood at ₹5,049.97 lakh, compared to ₹181.40 lakh in FY25.
The company’s Board of Directors recommended a final dividend of ₹0.20 per equity share of face value ₹10 each. The 35th Annual General Meeting (AGM) is scheduled for September 23, 2026, at the registered office in Mumbai.
Financial Performance
The company's total income rose to ₹5,087.22 lakh from ₹187.62 lakh in the prior year. This growth was primarily driven by its core business segments:
| Metric | FY26 (₹ in lakh) | FY25 (₹ in lakh) |
|---|---|---|
| Revenue from Operations | 5,049.97 | 181.40 |
| Other Income | 37.25 | 6.22 |
| Total Income | 5,087.22 | 187.62 |
| Profit Before Tax | 2,879.71 | 167.11 |
| Net Profit After Tax | 2,130.71 | 129.11 |
Revenue from Securities Market Trading and Advisory contributed ₹4,727.88 lakh, while Bullion Trading added ₹322.09 lakh. The company commenced bullion trading during the year, diversifying its revenue streams beyond traditional securities operations.
Balance Sheet and Cash Flow
Total assets increased substantially to ₹8,184.70 lakh from ₹226.37 lakh as of March 31, 2025. This expansion was supported by a strong cash position and equity raises.
| Balance Sheet Item | FY26 (₹ in lakh) | FY25 (₹ in lakh) |
|---|---|---|
| Total Assets | 8,184.70 | 226.37 |
| Equity Share Capital | 571.12 | 91.57 |
| Other Equity | 7,244.79 | 130.24 |
| Total Liabilities | 368.79 | 4.56 |
Cash and cash equivalents rose to ₹3,754.41 lakh, reflecting proceeds from capital issuance. Inventories, primarily closing stock of securities, stood at ₹4,289.16 lakh, up from ₹42.27 lakh in the previous year.
Capital Raises and Corporate Actions
During FY26, the company executed several significant corporate actions:
- Allotted 29,61,920 bonus equity shares on a 4:1 basis to existing shareholders.
- Increased authorized share capital from ₹5 crore to ₹7 crore.
- Issued 3,00,000 fully convertible warrants to promoters at ₹340 each.
- Allotted 18,33,595 equity shares to non-promoter public category groups at ₹290 each.
These actions expanded the paid-up equity share capital to 55,35,995 shares as of March 31, 2026.
What the Numbers Show
The divergence between the surge in net profit and the modest rise in operating expenses highlights the operational leverage gained from the new business verticals. While total expenses were ₹2,207.51 lakh, this included ₹6,427.29 lakh in purchases of stock in trade, which was largely offset by a decrease in inventory valuation adjustments. The substantial increase in other equity (₹7,244.79 lakh) indicates that the profit growth was amplified by significant capital inflows from preferential allotments and share premiums rather than organic retention alone.
Historical Stock Returns for Stellant Securities
| 1 Day | 5 Days | 1 Month | 6 Months | 1 Year | 5 Years |
|---|---|---|---|---|---|
| -5.00% | -17.56% | -22.38% | +16.15% | +399.74% | 0.0% |

How sustainable is the profit margin given that the revenue surge was largely driven by capital inflows and inventory adjustments rather than pure organic operational growth?
What specific growth strategies does Stellant Securities have for its newly launched bullion trading segment to ensure it becomes a consistent revenue contributor in FY27?
Will the substantial increase in paid-up equity and bonus shares dilute earnings per share (EPS) for existing investors in the near term despite the higher net profit?
 16
16









 Create Custom Screeners
  Access 200+ Pre-built Filters
  Use 50+ Readymade Screener





