

Simplex Infrastructures wins Rs 255.52 crore order from Oil India for drilling services


- Simplex Infrastructures won a confirmed Rs 255.52 crore work order from Oil India Limited for oil drilling services.
- The order represents ~93% of average quarterly revenue, with no other orders disclosed in the last 3 quarters.
- Quarterly OPM improved to 7.15% in Q1FY27, showing signs of better execution quality.
- Annual revenue declined by 6.4% YoY in FY26, continuing a multi-year downward trend despite recent profitability.
- High Total Liabilities/Equity of 2.97x requires monitoring of working capital funding for the new project.

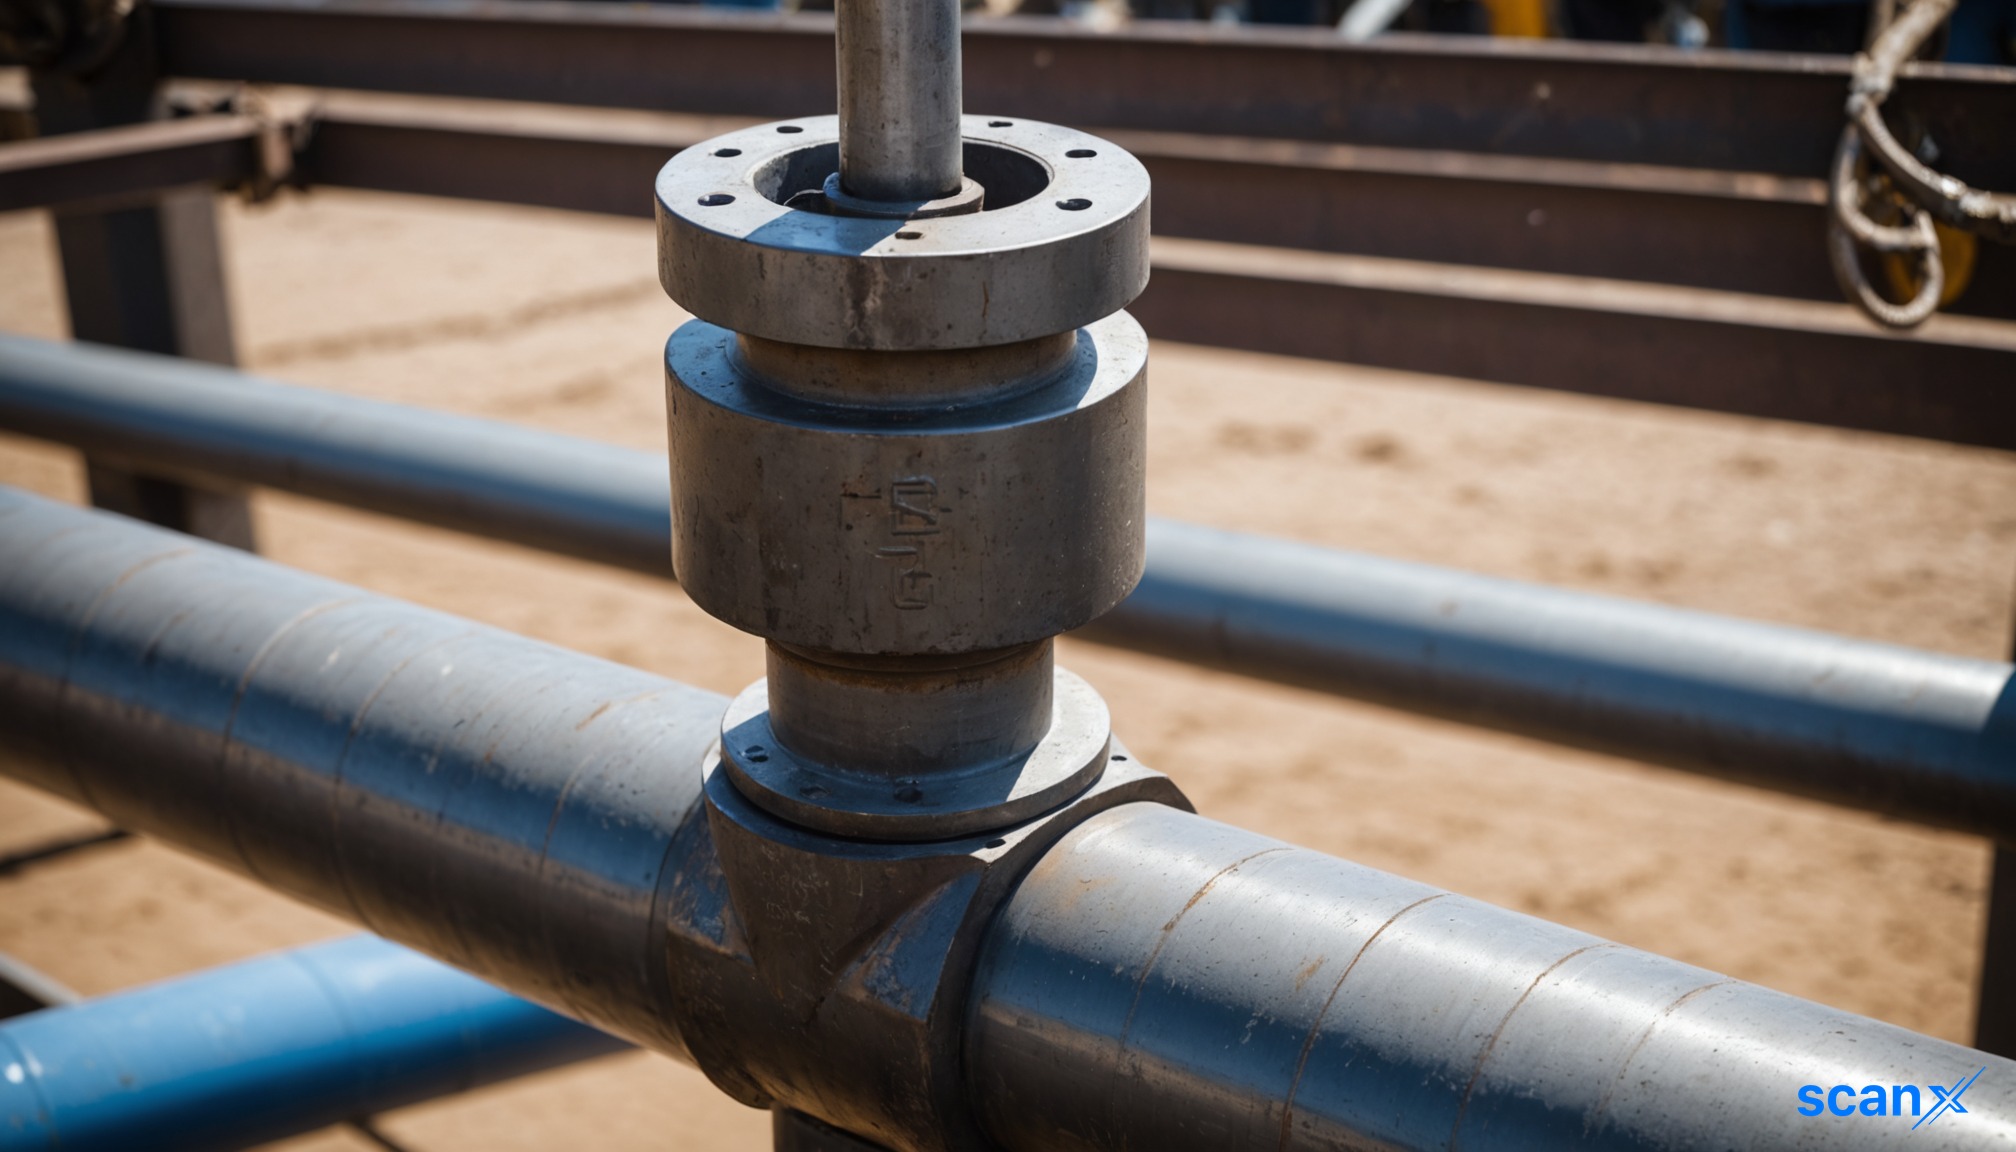

*this image is generated using AI for illustrative purposes only.
Simplex Infrastructures has secured a confirmed work order valued at Rs 255.52 crore from Oil India Limited for oil drilling services.
Order in Financial Context
The order value of Rs 255.52 crore represents approximately 93% of the company's average quarterly revenue of Rs 275.40 crore. As this is the only disclosed order in the last three fiscal quarters, the total disclosed order book stands at Rs 255.52 crore (sum of the 1 order disclosed across the last 3 fiscal quarters shown in the table below). Consequently, the book-to-bill ratio is low, and the pre-computed order book coverage indicates 0.00 quarters of backlog relative to current run-rates, suggesting that this new order will be a primary driver for near-term revenue recognition rather than adding to an existing large backlog.
Company Order Track Record
The company has not disclosed any other orders in the last three fiscal quarters, indicating a period of low order inflow velocity prior to this announcement. The current order size is substantial compared to the lack of recent disclosures, highlighting a potential shift in order momentum.
| Quarter | Total Order Inflow (Rs Cr) | Key Awarding Entities |
|---|---|---|
| Q1FY27 (Apr-Jun 2026) | 0.00 | None disclosed |
| Q4FY26 (Jan-Mar 2026) | 0.00 | None disclosed |
| Q3FY26 (Oct-Dec 2025) | 0.00 | None disclosed |
Execution and Revenue Quality
Recent quarterly performance shows consistent profitability and improving operating margins. Net profit remained positive in all three reported quarters, with Operating Profit Margin (OPM) rising from 4.06% in Q3FY26 to 7.15% in Q1FY27, indicating better execution efficiency or margin recovery in recent periods.
| Quarter | Revenue (Rs Cr) | Net Profit (Rs Cr) | OPM (%) |
|---|---|---|---|
| Q1FY27 | 293.80 | 10.70 | 7.15% |
| Q4FY26 | 284.40 | 18.80 | 7.57% |
| Q3FY26 | 265.80 | 8.10 | 4.06% |
Revenue Growth - Order Wins Translating to Revenue
Despite recent order wins, the company's annual revenue has declined from Rs 2092.90 crore in FY22 to Rs 1056.30 crore in FY26, representing a YoY growth of -6.4% based on the latest annual data. The historical trend shows consecutive years of negative revenue growth, suggesting that past order inflows have not yet fully offset the decline in legacy projects or that execution timelines have stretched.
Working Capital and Execution Capacity
The company maintains a healthy current ratio of 2.29x, providing sufficient liquidity to manage short-term obligations. However, Total Liabilities/Equity stands at 2.97x, indicating elevated leverage levels when considering all liabilities including trade payables. Operating cashflow was positive at Rs 74.40 crore in FY26, a significant improvement from negative cashflows in previous years, suggesting better conversion of earnings to cash.
What to Watch
- Execution Rate: Monitor how quickly the Rs 255.52 crore order converts into recognized revenue, given the low existing backlog coverage.
- Margin Sustainability: Track whether the improved OPM of 7.15% in Q1FY27 can be sustained as the new drilling services contract executes.
- Client Concentration: Oil India Limited accounts for 100% of the currently disclosed order book, creating significant client concentration risk.
- Cash Conversion: Observe if the positive operating cashflow trend continues as working capital requirements for the new project increase.
Key Observations
- Backlog signal: Book-to-bill ratio is effectively driven by this single new order due to zero prior disclosures; execution capacity becomes the binding constraint for realizing this value.
- Leverage flag: Total Liabilities/Equity of 2.97x; balance sheet carries elevated liabilities, and ability to fund working capital for the existing backlog should be monitored.
- Valuation check (as of 05 Oct 2026): P/E of 42.5x against ROCE of 2.48%. At the time of this article, valuation was pricing in execution improvement not yet visible in return ratios.
Historical Stock Returns for Simplex Infrastructures
| 1 Day | 5 Days | 1 Month | 6 Months | 1 Year | 5 Years |
|---|---|---|---|---|---|
| +1.14% | +0.46% | -4.38% | +34.78% | -12.52% | +443.33% |

 17
17










 Access Market Heat-map & Insights
  Create, Save & Share your Screener
  Use 200+ Screening Filters





