

Sambandam Spinning Mills FY26 Results: Net loss narrows to ₹5.74 crore


- Net loss narrowed 22.7% YoY to ₹5.74 crore from ₹7.43 crore in FY25
- Revenue fell 1.8% to ₹2,636.6 crore amid steep yarn price declines
- EBITDA grew 19.8% to ₹128.7 crore driven by operational efficiencies
- Direct exports surged to ₹154.5 crore from ₹48.6 crore in previous year
- No dividend recommended; AGM scheduled for September 18, 2026



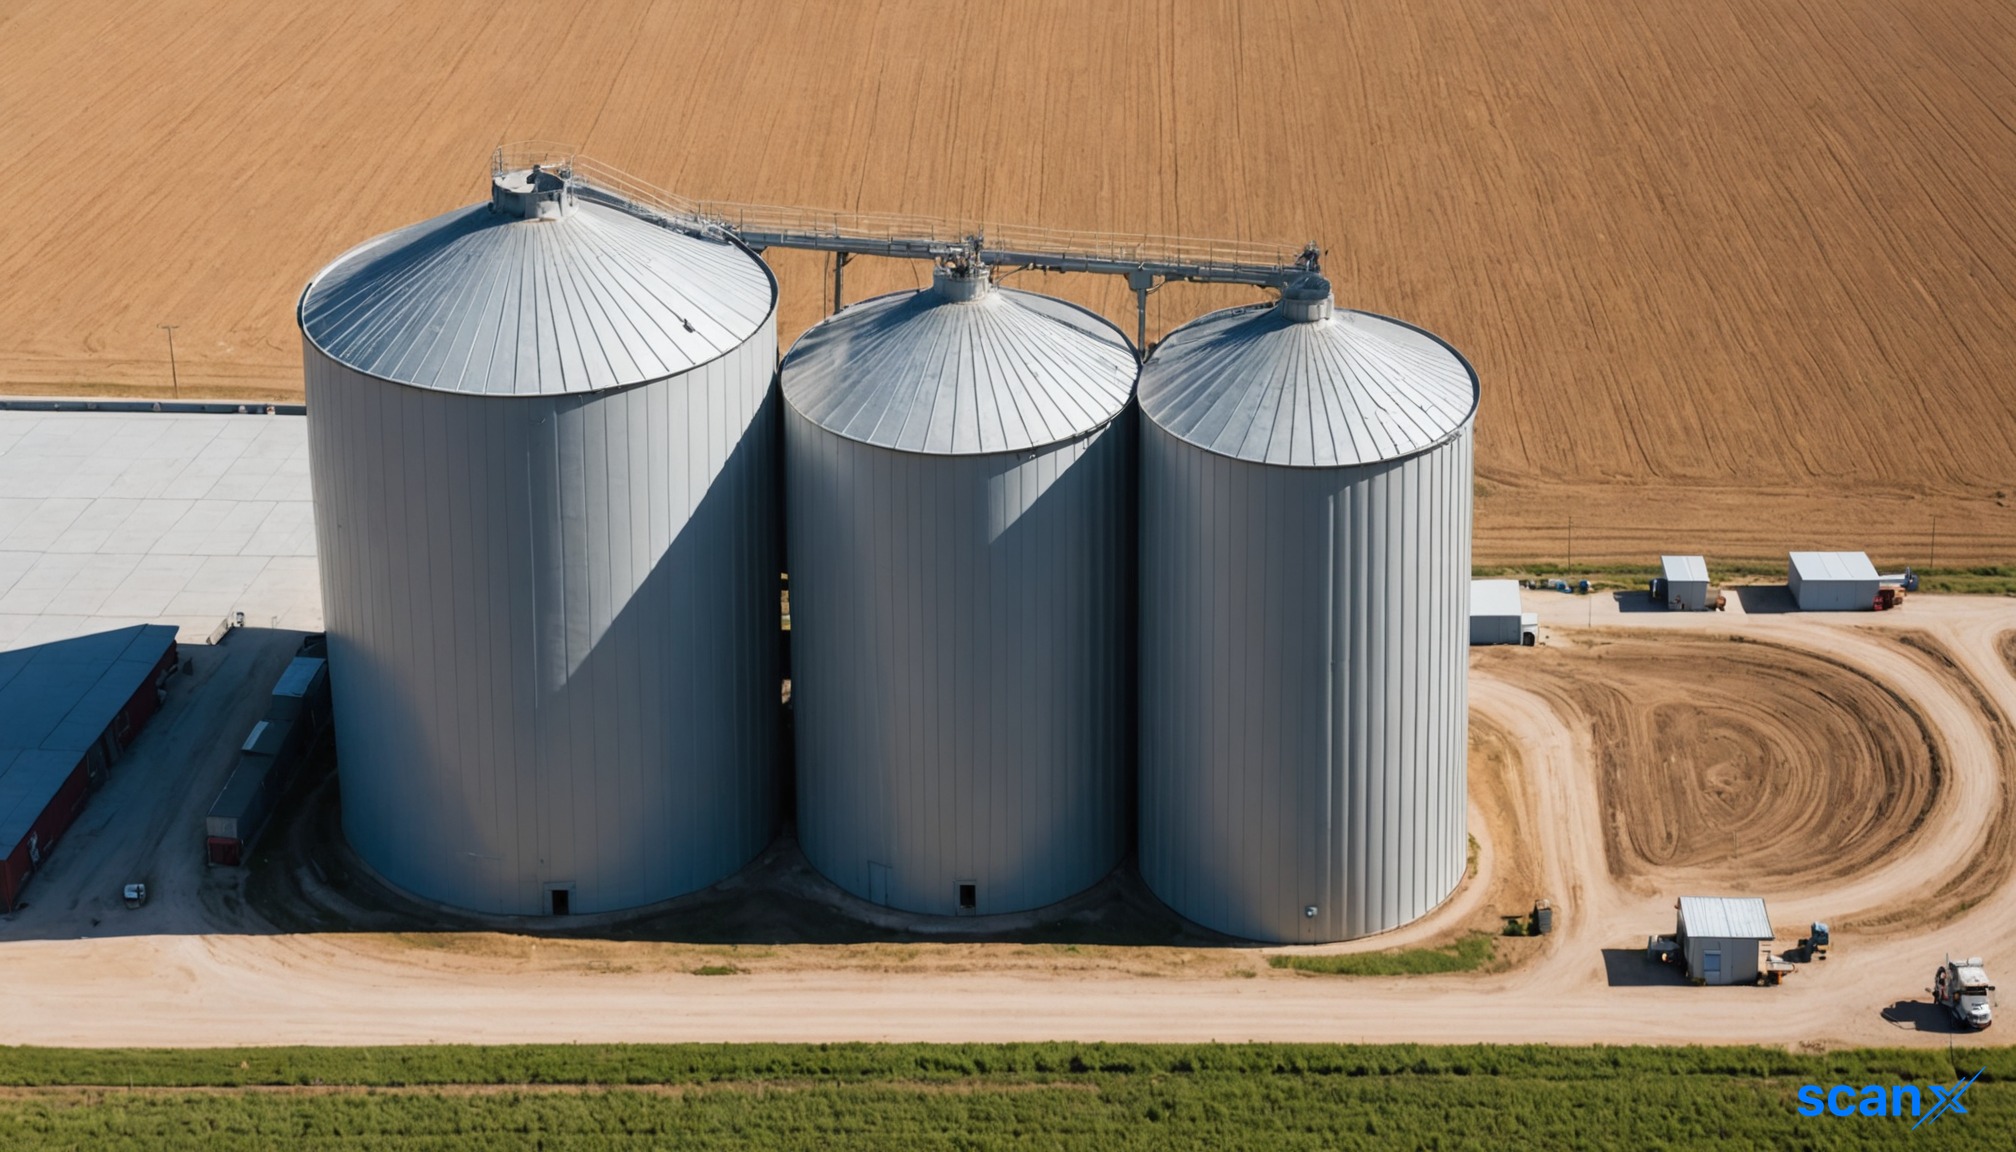
*this image is generated using AI for illustrative purposes only.
Sambandam Spinning Mills reported a narrowed net loss of ₹5.74 crore for the financial year ended March 2026, improving from the ₹7.43 crore loss recorded in FY25. The company’s revenue from operations declined by 1.8% year-on-year to ₹2,636.6 crore, reflecting the challenging pricing environment in the textile sector.
The improvement in the bottom line was primarily driven by better operating margins and improved working capital management, despite a marginal decline in top-line sales. Gross production volume increased slightly to 87.39 lakh kg from 86.82 lakh kg in the previous year, while sale volume rose to 90.92 lakh kg from 88.89 lakh kg.
Financial Performance
| Metric | FY26 | FY25 | Change |
|---|---|---|---|
| Revenue from Operations | ₹2,636.6 crore | ₹2,684.8 crore | -1.8% |
| EBITDA | ₹128.7 crore | ₹107.4 crore | +19.8% |
| Net Loss | ₹5.74 crore | ₹7.43 crore | -22.7% |
| EPS (₹) | (13.46) | (17.43) | Improvement |
The company’s EBITDA expanded by nearly 20% to ₹128.7 crore from ₹107.4 crore in FY25, indicating improved operational efficiency. This margin expansion occurred despite a steep decline in selling prices of yarn, which fell more sharply than raw material costs. Management attributed this to strategic shifts towards value-added counts and timely procurement of cotton during periods of reasonable pricing.
Operational Highlights
Capacity utilization remained steady at approximately 90% during the year, constrained by uncertainties in off-take. However, the company effectively managed power costs through its green energy initiatives. Solar and wind energy sources contributed 322.98 lakh kWh towards overall power requirements, helping sustain power cost per unit even as quantitative power consumption decreased.
Direct exports surged significantly to ₹154.5 crore from ₹48.6 crore in the previous year, offsetting some domestic market pressures. Conversely, merchandise exports declined to ₹6 crore from ₹11.7 crore. Domestic sales accounted for the bulk of revenue at ₹2,469.5 crore, down from ₹2,613.5 crore in FY25.
What the Numbers Show
A key divergence in the data is the widening gap between revenue decline and EBITDA growth. While revenue contracted by 1.8%, EBITDA expanded by 19.8%. This suggests that the company successfully passed on some cost efficiencies or benefited from lower input costs relative to output prices in specific segments, particularly value-added yarns. Additionally, the debtor turnover ratio improved to 13.26 times from 10.55 times, indicating stronger collection efficiency despite the sluggish market conditions.
Board and Corporate Actions
The 52nd Annual General Meeting is scheduled for September 18, 2026. Key agenda items include the reappointment of Joint Managing Director S. Dinakaran beyond the age of 70 years and the appointment of two new independent directors, T.C.A. Srinivasa Prasad and S. Prakash, to replace outgoing directors Dr. V. Sekar and D. Balasundaram.
The board did not recommend any dividend for FY26 due to the incurred loss. Statutory auditors P.N. Raghavendra Rao & Co. confirmed their eligibility for reappointment for the term ending at the 53rd AGM in 2027.
Historical Stock Returns for Sambandam Spinning Mills
| 1 Day | 5 Days | 1 Month | 6 Months | 1 Year | 5 Years |
|---|---|---|---|---|---|
| 0.0% | -1.73% | -10.81% | +0.24% | +0.24% | +0.24% |

How sustainable is the current EBITDA margin expansion if raw material costs rise faster than yarn selling prices in the next fiscal year?
Will the strategic shift towards value-added counts continue to drive revenue growth, or will domestic market saturation limit further top-line recovery?
What is the long-term impact of the 322.98 lakh kWh green energy contribution on operational costs and regulatory compliance over the next three years?
 19
19






 Create Custom Screeners
  Access 200+ Pre-built Filters
  Use 50+ Readymade Screener





