

Pyramid Technoplast Q1FY27 profit rises 32% as revenue surges 36%


Pyramid Technoplast Limited reported a 32% year-on-year increase in net profit to ₹104.45 lakh for Q1FY27, driven by a 36% surge in revenue from operations to ₹2,224.90 lakh. The Mumbai-based industrial packaging company’s strong financial performance was underpinned by the commissioning of a recycling plant and a solar power facility, which are already contributing to cost reductions and margin expansion. Management expects these strategic investments to further enhance profitability in FY27, with targeted EBITDA margins of 11–12%.



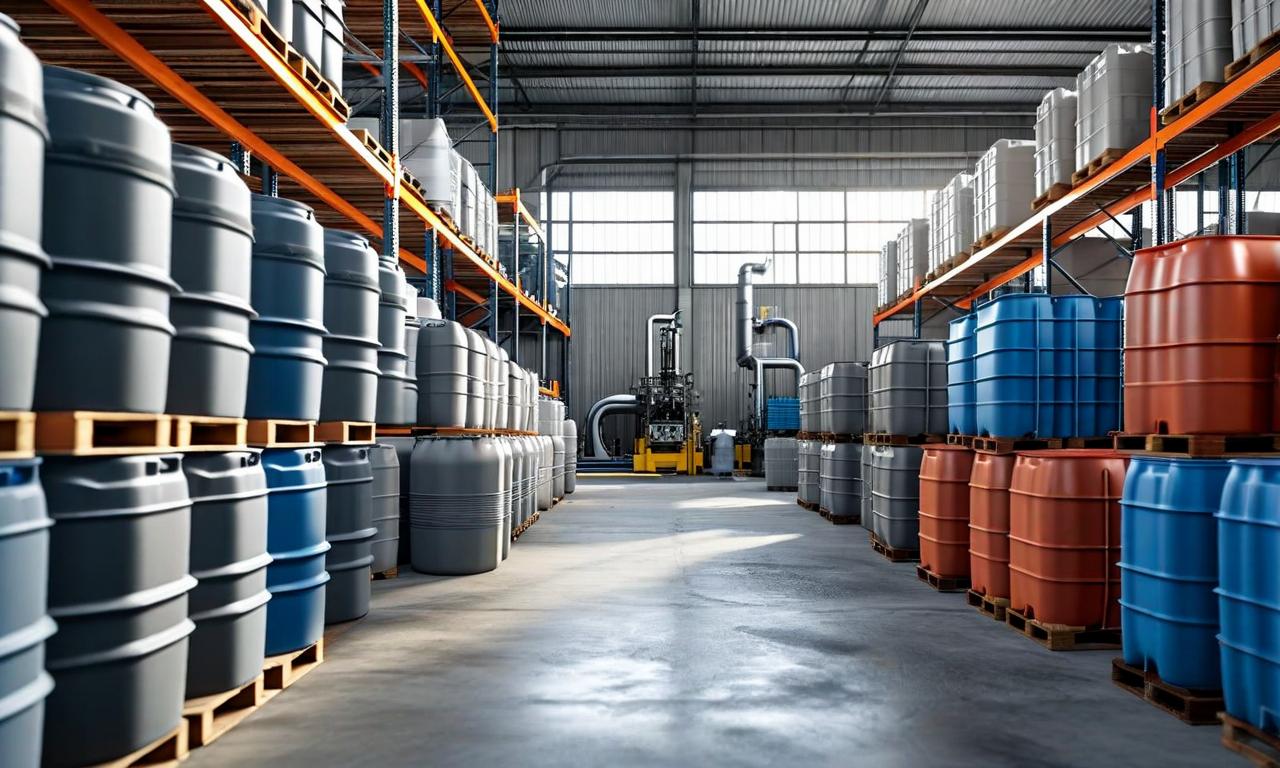
*this image is generated using AI for illustrative purposes only.
Pyramid Technoplast Limited reported a 32% year-on-year increase in net profit to ₹104.45 lakh for the quarter ended June 30, 2026, driven by a 36% surge in revenue from operations to ₹2,224.90 lakh. The Mumbai-based industrial packaging company’s strong financial performance was underpinned by the commissioning of a recycling plant and a solar power facility, which are already contributing to cost reductions and margin expansion. Management expects these strategic investments to further enhance profitability in FY27, with targeted EBITDA margins of 11–12%.
The Board of Directors approved the unaudited financial results and the limited review report of the statutory auditor on August 11, 2026. In a significant governance move, the Board also approved the appointment of M/s Desai Saksena & Associates (Firm Registration No.: 102358W) as the new Statutory Auditors for a five-year term, subject to shareholder approval at the 28th Annual General Meeting. The company simultaneously released its investor presentation, detailing the operational impact of its recent capital expenditures.
Financial Performance Highlights
Revenue from operations grew by 35.8% to ₹2,224.90 lakh in Q1FY27, up from ₹1,638.11 lakh in Q1FY26. This top-line growth was primarily driven by improved realizations and strong volume growth in Mild Steel (MS) drums and Intermediate Bulk Containers (IBCs). Net profit after tax rose to ₹104.45 lakh from ₹79.08 lakh previously. EBITDA expanded to ₹202 million from ₹133 million year-on-year, with EBITDA margin improving to 9.1% from 8.14%. The following table summarises the key financial metrics:
| Metric | Q1FY27 (₹ in Lakhs) | Q1FY26 (₹ in Lakhs) | Change (%) |
|---|---|---|---|
| Revenue from Operations | 2,224.90 | 1,638.11 | +35.80% |
| Total Income | 2,235.12 | 1,646.62 | +35.70% |
| Profit Before Tax | 139.58 | 105.68 | +32.10% |
| Net Profit After Tax | 104.45 | 79.08 | +32.10% |
| Earnings Per Share (Basic) | ₹2.85 | ₹2.16 | +32.00% |
Strategic Investments Driving Efficiency
The company’s recent capital expenditures are beginning to yield tangible financial benefits. A recycling plant, commissioned on October 3, 2025, with an investment of ₹8–10 crore, processed 155 MT of material in Q1FY27, generating an EBITDA profit of ₹25 lakh. Management estimates this facility will contribute approximately ₹2 crore to EBITDA in FY27 while catering to 10–12% of the company’s raw material needs. Additionally, a solar power plant commissioned on October 30, 2025, with an investment over ₹60 crore, delivered savings of ₹2 crore in Q1FY27, with estimated annual savings of ₹15 crore for FY27.
Operational Capacity and Outlook
Pyramid Technoplast operates across nine manufacturing units with a total production capacity of 83,745 MTPA. Current utilization stands at 62%, which management attributes to near-term volume impacts from geopolitical tensions, though per-tonne profitability remains unaffected. The company plans to deploy ₹20–25 crore in capex during FY27, primarily for the Kutch expansion, funded through internal accruals. Management forecasts revenue growth of approximately 15% for FY27, supported by a greater revenue share from high-margin IBC products and increased automation in metal drum production.
What the Numbers Show
The primary driver of improved financial performance was top-line growth in the industrial packaging segment, which accounts for the company's entire operations under Ind AS 108. While finance costs increased to ₹35.14 lakh from ₹12.60 lakh, indicating higher borrowing or interest rates, the impact on bottom-line profits was mitigated by operational leverage. The simultaneous expansion of EBITDA margin to 9.1% alongside revenue growth suggests that cost management initiatives, particularly from the new recycling and solar facilities, are effectively offsetting input cost pressures. The diversified customer base, with the top customer contributing only 6% to revenues, further reduces dependency risk.
Historical Stock Returns for Pyramid Technoplast
| 1 Day | 5 Days | 1 Month | 6 Months | 1 Year | 5 Years |
|---|---|---|---|---|---|
| -0.69% | +1.13% | -1.99% | -2.37% | -5.05% | -15.07% |

How might the planned ₹20–25 crore capex for the Kutch expansion impact Pyramid Technoplast's debt-to-equity ratio and interest coverage in FY27?
What specific risks could arise from the company's reliance on internal accruals to fund its FY27 capital expenditures amidst rising finance costs?
How will the shift towards a higher revenue share from high-margin IBC products affect the company's competitive positioning against larger industrial packaging players?
 16
16








 Create Custom Screeners
  Access 200+ Pre-built Filters
  Use 50+ Readymade Screener





