

PTL Enterprises Q1 Results: Net Profit Falls 5% YoY, EBITDA Margin Contracts


PTL Enterprises reported a 5.1% YoY decline in Q1 net profit to ₹875.21 lakh, with revenue from operations stable at ₹1,608.31 lakh. EBITDA contracted to 140M Rupees from 146M Rupees YoY, with EBITDA margin narrowing to 87.34% from 90.84%, reflecting higher expenses and lower other income.


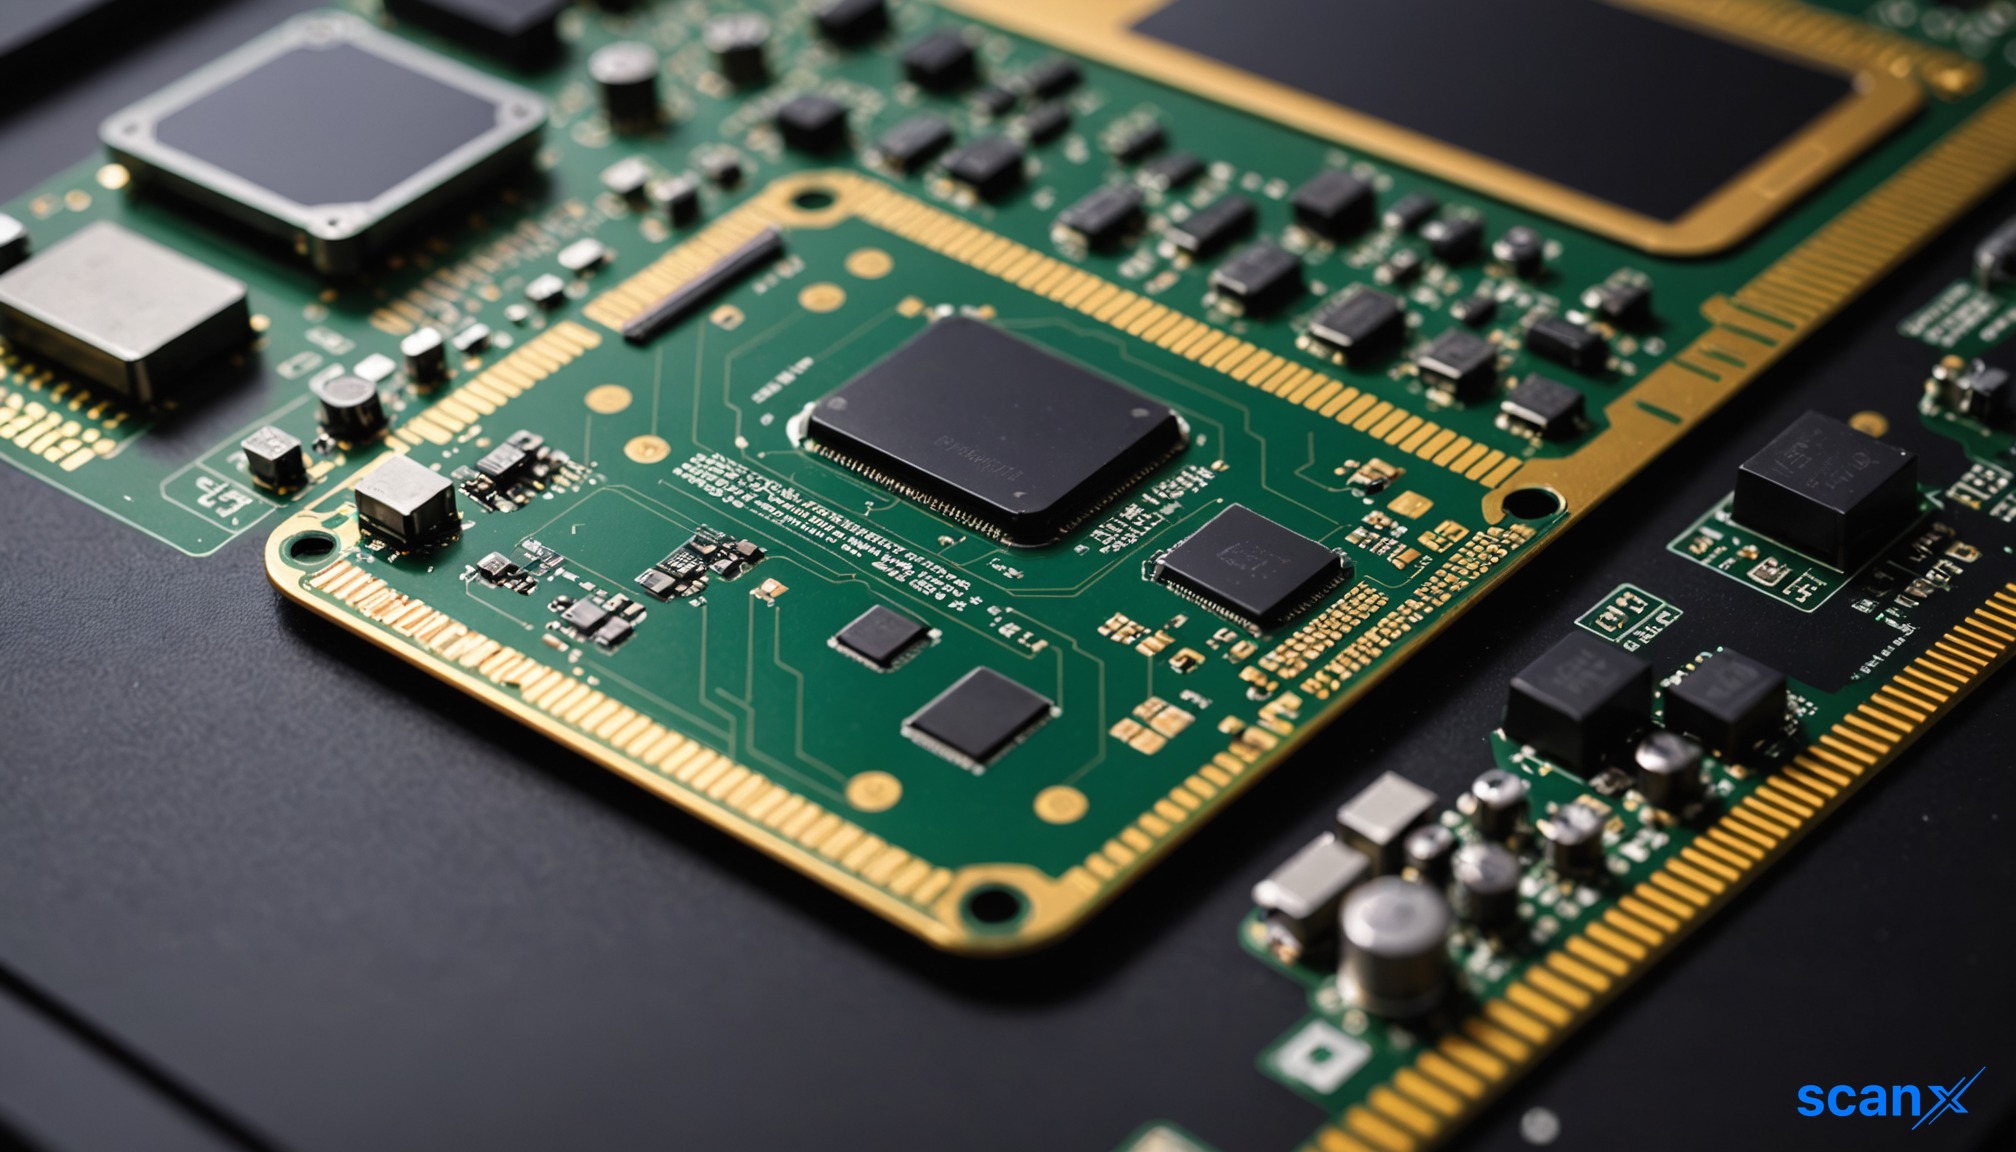
*this image is generated using AI for illustrative purposes only.
PTL Enterprises Limited reported a net profit of ₹875.21 lakh for the quarter ended June 30, 2026, reflecting a 5.1% year-on-year decline from ₹922.08 lakh in Q1FY25. The company's revenue from operations remained stable at ₹1,608.31 lakh, identical to the same period last year, while EBITDA stood at 140M Rupees compared to 146M Rupees in the corresponding period, with the EBITDA margin contracting to 87.34% from 90.84% year-on-year. This performance underscores the volatility in non-operating revenues despite consistent core lease income from its primary business segment.
The Board of Directors approved the unaudited financial results on August 6, 2026, following a review by the Audit Committee. The results were prepared in accordance with Indian Accounting Standards (Ind AS) and Regulation 33 of the SEBI (Listing Obligations and Disclosure Requirements) Regulations, 2015. SCV & Co. LLP, the statutory auditors, issued a limited review report expressing an unmodified conclusion on the financial statements.
Financial Performance Overview
While operating revenue held steady, the company faced pressure from reduced other income and higher finance costs. Other income plummeted to ₹13.00 lakh in Q1FY26, down from ₹393.74 lakh in the preceding quarter ended March 31, 2026, and ₹10.69 lakh in Q1FY25. Total expenses rose to ₹362.47 lakh from ₹317.35 lakh in the corresponding period last year, driven primarily by an increase in other expenses. The key financial metrics for the quarter are presented below:
| Particulars: | Q1FY26 (₹ Lakhs) | Q4FY26 (₹ Lakhs) | Q1FY25 (₹ Lakhs) | FY26 Full Year (₹ Lakhs) |
|---|---|---|---|---|
| Revenue from Operations | 1,608.31 | 1,607.42 | 1,608.31 | 6,434.11 |
| Other Income | 13.00 | 393.74 | 10.69 | 962.20 |
| Total Income | 1,621.31 | 2,001.16 | 1,619.00 | 7,396.31 |
| Total Expenses | 362.47 | 289.72 | 317.35 | 1,242.27 |
| Profit Before Tax | 1,258.84 | 1,711.44 | 1,301.65 | 6,154.04 |
| Net Profit | 875.21 | 1,324.49 | 922.08 | 4,616.93 |
| EPS (Basic) | ₹0.66 | ₹1.00 | ₹0.70 | ₹3.49 |
EBITDA and Margin Performance
On an operational efficiency basis, EBITDA for the quarter came in at 140M Rupees versus 146M Rupees in the year-ago period. The EBITDA margin contracted by approximately 350 basis points to 87.34% from 90.84% year-on-year, reflecting the impact of rising total expenses on the company's lean cost structure. The following table summarises the key operational metrics:
| Metric: | Q1FY26 | Q1FY25 |
|---|---|---|
| Revenue | 161M Rupees | 161M Rupees |
| Net Profit | 88M Rupees | 92M Rupees |
| EBITDA | 140M Rupees | 146M Rupees |
| EBITDA Margin | 87.34% | 90.84% |
What the Numbers Show
A key analytical observation is the significant divergence between total income and net profit trends due to the behavior of other income. While revenue from operations is flat and predictable—derived predominantly from leasing plant machinery to Apollo Tyres Ltd.—other income exhibits high volatility. It surged to ₹393.74 lakh in Q4FY26 before collapsing to ₹13.00 lakh in Q1FY26, suggesting that recent profitability spikes were non-recurring or investment-driven rather than operational. Consequently, the core operational margin remains robust, with profit before tax staying above ₹1,200 lakh despite the dip in other income.
Regulatory and Operational Notes
The company noted that its operations comprise a single business segment: income from the lease of plant to Apollo Tyres Ltd. Management confirmed the implementation of applicable provisions under the new Labour Codes notified by the Government of India in November 2025. The company continues to monitor regulatory developments regarding these codes to assess further accounting implications. Earnings per share stood at ₹0.66, down from ₹0.70 in Q1FY25.
Historical Stock Returns for PTL Enterprises
| 1 Day | 5 Days | 1 Month | 6 Months | 1 Year | 5 Years |
|---|---|---|---|---|---|
| +1.46% | +1.24% | -0.23% | -0.18% | -3.38% | +62.11% |

How will the implementation of the new Labour Codes notified in November 2025 impact PTL Enterprises' future operational costs and compliance expenses?
Given the extreme volatility in other income, what specific investment strategies or non-operating assets are driving these fluctuations, and are they sustainable?
With revenue growth stagnant and dependent primarily on Apollo Tyres Ltd., what is the timeline for renewing or renegotiating the lease agreement, and how might it affect future margins?
 15
15







 Create Custom Screeners
  Access 200+ Pre-built Filters
  Use 50+ Readymade Screener





