

PTL Enterprises Q1 Results: Net profit falls 5% YoY to ₹875.21 million


PTL Enterprises posted a net profit of ₹875.21 million in Q1FY27, down 5.1% YoY, while revenue stayed flat at ₹1,608.31 million. Comprehensive income fell 15.7% to ₹2,549.16 million. The Board approved the results on August 6, 2026.


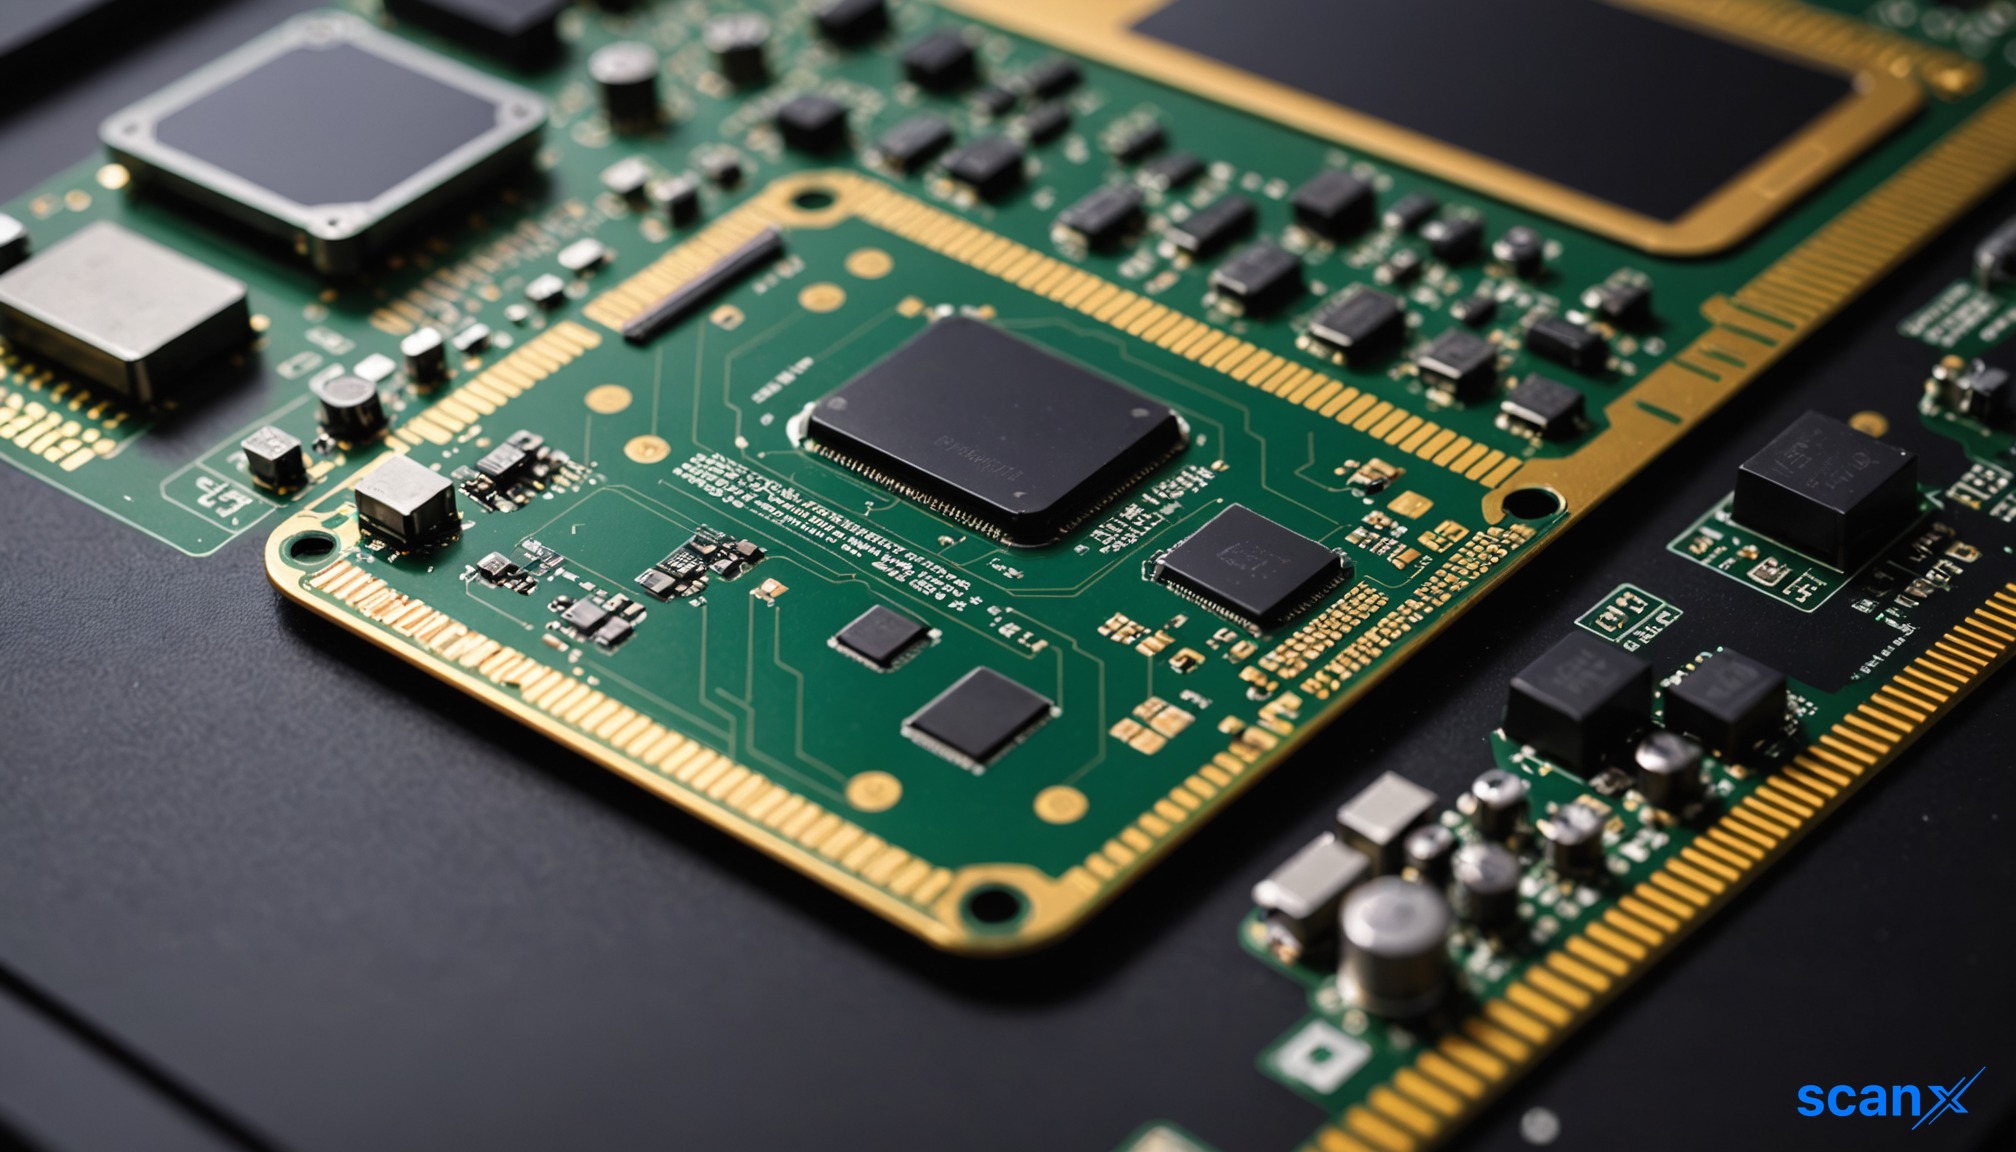
*this image is generated using AI for illustrative purposes only.
PTL Enterprises reported a net profit of ₹875.21 million for the quarter ended June 30, 2026, marking a 5.1% decline from ₹922.08 million in the corresponding period of FY26. Total income from operations remained flat at ₹1,608.31 million, matching the previous year’s figure. The results were approved by the Board of Directors on August 6, 2026, and filed with stock exchanges under Regulation 33 of the SEBI (Listing Obligations and Disclosure Requirements) Regulations, 2015.
The company’s net profit before tax stood at ₹1,258.84 million, compared to ₹1,301.65 million in Q1FY26. Total comprehensive income for the quarter was ₹2,549.16 million, down from ₹3,023.25 million in the prior year. Paid-up equity share capital remained unchanged at ₹1,323.77 million.
Financial Highlights
| Metric | Q1FY27 (₹ Mn) | Q1FY26 (₹ Mn) | Change |
|---|---|---|---|
| Total Income | 1,608.31 | 1,608.31 | 0.0% |
| Net Profit Before Tax | 1,258.84 | 1,301.65 | -3.3% |
| Net Profit After Tax | 875.21 | 922.08 | -5.1% |
| Comprehensive Income | 2,549.16 | 3,023.25 | -15.7% |
| Basic EPS (₹) | 0.66 | 0.70 | -5.7% |
For the full year ended March 31, 2026, PTL Enterprises reported total income of ₹6,434.11 million and a net profit after tax of ₹4,616.93 million. Reserves excluding revaluation reserves stood at ₹53,423.14 million as of March 31, 2026.
What the Numbers Show
The flat revenue performance alongside a decline in net profit suggests margin pressure during the quarter. While top-line growth stalled, the relatively smaller drop in pre-tax profit indicates that operating costs may have been managed effectively, with the post-tax decline likely influenced by tax provisions or other non-operating items not detailed in the extract.
Historical Stock Returns for PTL Enterprises
| 1 Day | 5 Days | 1 Month | 6 Months | 1 Year | 5 Years |
|---|---|---|---|---|---|
| +1.46% | +1.24% | -0.23% | -0.18% | -3.38% | +62.11% |

What specific operational or external factors contributed to the margin compression despite flat revenue in Q1FY27?
How does management plan to address the 15.7% decline in comprehensive income to restore investor confidence?
Are there upcoming strategic initiatives or cost-optimization measures expected to drive top-line growth in subsequent quarters?
 18
18









 Access Market Heat-map & Insights
  Create, Save & Share your Screener
  Use 200+ Screening Filters





