

Premier Energies files FY26 BRSR; Deloitte provides reasonable assurance on core KPIs


- Premier Energies files FY26 BRSR with Deloitte providing reasonable assurance on core KPIs
- Total energy consumption rose to 7,43,553.85 GJ, with renewables contributing 48,923.97 GJ
- GHG emissions increased to 1,28,177.35 MT CO2e, up from 91,003.67 MT in FY25
- Water withdrawal jumped 40% to 4,74,523 KL, while zero liquid discharge remains at 100%
- Total waste generated reached 17,561.15 MT, with 5,443.51 MT recovered via recycling

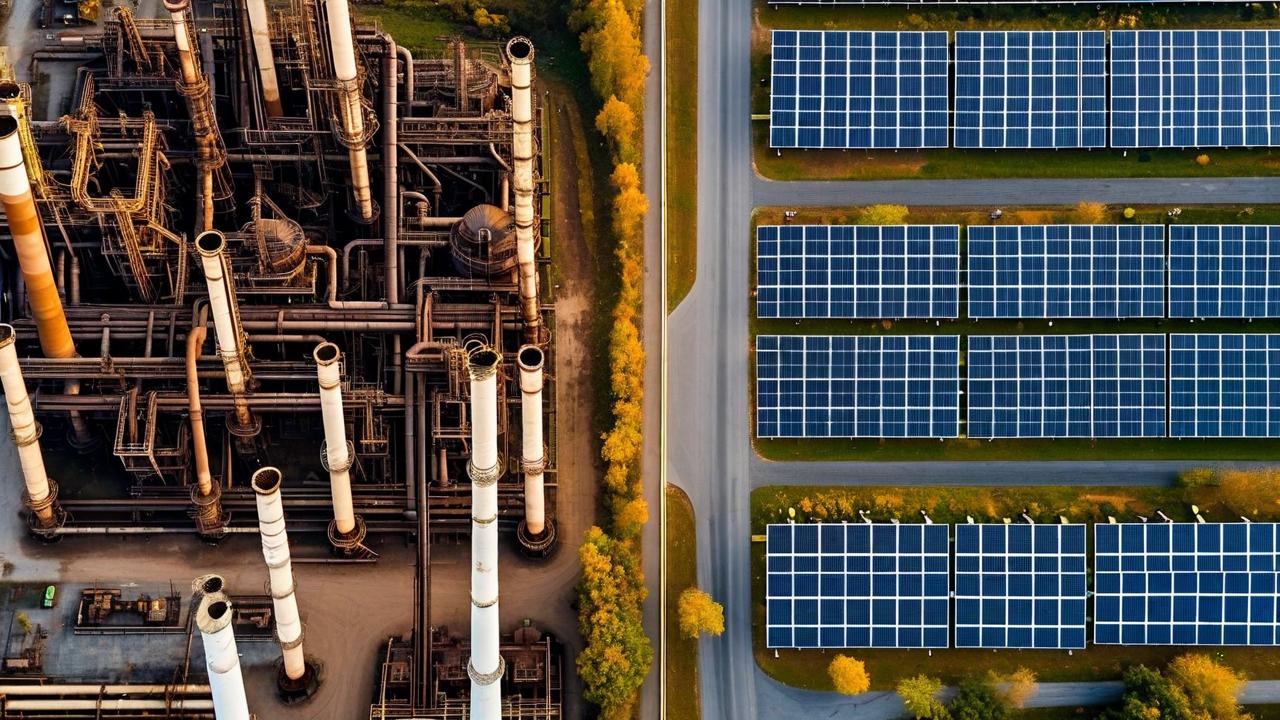

*this image is generated using AI for illustrative purposes only.
Premier Energies has submitted its Business Responsibility and Sustainability Report (BRSR) for the financial year ended March 31, 2026, to the stock exchanges. The filing includes an Independent Practitioner’s Assurance Report from Deloitte Haskins & Sells LLP, which provided reasonable assurance on core sustainability indicators and limited assurance on select additional metrics.
The report covers the company’s consolidated operations, excluding associate companies and greenfield projects under construction. Premier Energies operates six manufacturing plants and two offices nationally, alongside two international offices. Its primary business activities involve the manufacturing of photovoltaic solar cells and modules, which accounted for 97.34% of the total turnover in FY26.
Environmental Performance and Resource Usage
Total energy consumption rose to 7,43,553.85 GJ in FY26, up from 4,99,031.25 GJ in the previous year. Renewable sources contributed 48,923.97 GJ, while non-renewable sources accounted for 6,94,629.88 GJ. Greenhouse gas emissions (Scope 1 and Scope 2) increased to 1,28,177.35 metric tons of CO2 equivalent, compared to 91,003.67 metric tons in FY25.
Water withdrawal grew significantly to 4,74,523 kilolitres from 3,39,211 kilolitres in FY25. The company reported total water discharge of 6,938 kilolitres, primarily sent to third parties without treatment due to temporary maintenance at its Effluent Treatment Plant. Premier Energies confirmed that 100% of its PV cell manufacturing facilities in India operate with a Zero Liquid Discharge mechanism.
| Metric | FY26 | FY25 |
|---|---|---|
| Total Energy Consumption (GJ) | 7,43,553.85 | 4,99,031.25 |
| Total GHG Emissions (MT CO2e) | 1,28,177.35 | 91,003.67 |
| Water Withdrawal (KL) | 4,74,523.00 | 3,39,211.00 |
| Total Waste Generated (MT) | 17,561.15 | 10,886.42 |
Waste Management and Social Metrics
Total waste generated increased to 17,561.15 metric tons in FY26, driven largely by other non-hazardous waste (13,101.42 MT) and other hazardous waste (3,434.91 MT). Of this, 5,443.51 metric tons were recovered through recycling or reuse. The company reported no landfilling of waste in FY26.
On the social front, Premier Energies employed 583 permanent employees and engaged 8,497 workers as of March 31, 2026. Female representation stood at 13.55% among employees and 30.27% among workers. The company reported one recordable work-related injury among workers, resulting in a Lost Time Injury Frequency Rate (LTIFR) of 0.049. No fatalities or high-consequence injuries were recorded.
Governance and Compliance
The Board of Directors comprises 12 members, with women holding 33.33% of the seats. Key Management Personnel included one woman (25.00%). The company maintains ISO 9001:2015, ISO 45001:2018, and ISO 14001:2015 certifications across its operational sites. Deloitte’s assurance scope excluded qualitative disclosures and forward-looking statements, focusing strictly on quantitative data within the defined reporting boundary.
What the Numbers Show
The divergence between rising energy consumption (+49%) and higher absolute GHG emissions (+41%) suggests that while renewable energy adoption increased (from 29,588 GJ to 48,923 GJ), the overall expansion in manufacturing output drove a net increase in carbon footprint. Additionally, water withdrawal surged by 40%, outpacing the growth in waste generation, indicating intensified resource usage per unit of production or expansion in facility capacity.
Historical Stock Returns for Premier Energies
| 1 Day | 5 Days | 1 Month | 6 Months | 1 Year | 5 Years |
|---|---|---|---|---|---|
| -0.31% | +1.58% | -7.00% | -7.10% | -11.49% | +7.87% |

How will Premier Energies plan to decouple its rising energy consumption and GHG emissions from production growth in FY27?
What specific measures are being implemented to address the temporary maintenance issues at the Effluent Treatment Plant that led to untreated water discharge?
Given the 40% surge in water withdrawal, what long-term strategies is the company adopting to improve water efficiency per unit of solar module produced?
 18
18









 Access 50+ Readymade Screeners
  Use 200+ Custom Filters
  Get Full Market Insights





