

Pondy Oxides & Chemical files FY26 BRSR with ₹2,938.65 crore turnover


- Pondy Oxides & Chemical reports FY26 turnover of ₹2,938.65 crore and net worth of ₹799.85 crore
- Exports contribute 66% of total turnover across 14 international markets
- Energy intensity per rupee of turnover improves to 0.07 from 0.10 in FY25
- Permanent employee turnover rises to 11.32% while worker turnover jumps to 24.75%
- Related-party loans remain at 100% of total loans and advances



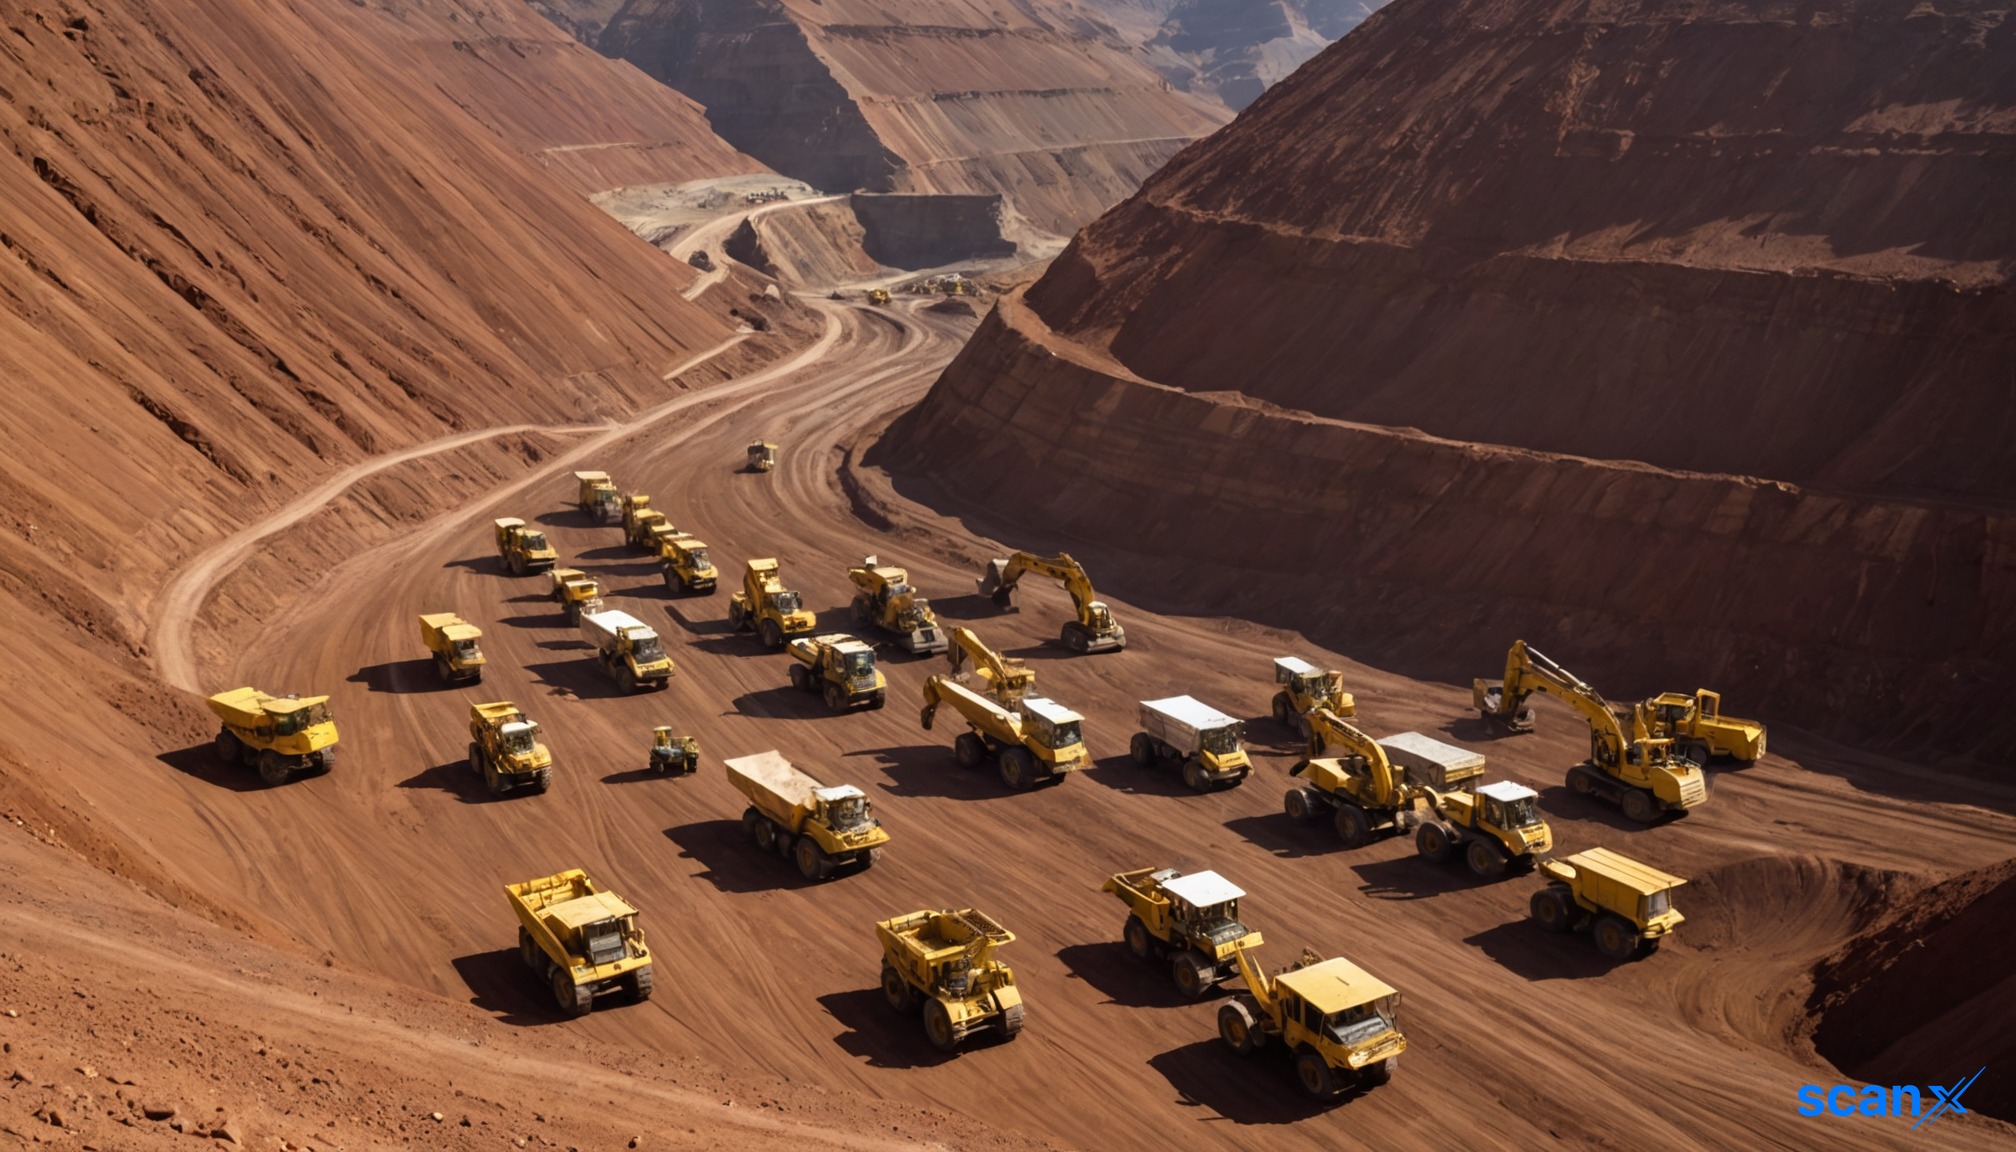
*this image is generated using AI for illustrative purposes only.
Pondy Oxides & Chemical Limited has filed its Business Responsibility and Sustainability Report (BRSR) for the financial year 2025-26. The report discloses a standalone turnover of ₹2,938.65 crore and a net worth of ₹799.85 crore. The filing outlines the company’s environmental, social, and governance performance across its operations.
The Chennai-based recycler reported significant shifts in its operational footprint and resource efficiency during the period. Exports accounted for 66% of total turnover, serving customers in 14 countries alongside domestic operations in 11 states. The company operates four plants and one office nationally, with no international locations.
Operational and Financial Overview
Lead and lead alloys remained the dominant revenue driver, contributing 76.69% of turnover. Copper products accounted for 14.36%. The company reported a paid-up capital of ₹15.26 crore (7,62,78,197 equity shares of ₹2/- each). CSR obligations were applicable under Section 135 of the Companies Act, 2013.
| Metric | Value |
|---|---|
| Turnover (FY26) | ₹2,938.65 crore |
| Net Worth | ₹799.85 crore |
| Export Contribution | 66% |
| Paid-up Capital | ₹15.26 crore |
Environmental Performance
Energy consumption from non-renewable sources rose to 21,265 GJ in FY26, up from 19,580 GJ in FY25. However, renewable energy usage was recorded at 504 GJ, a new disclosure category. Total energy intensity per rupee of turnover improved to 0.07 from 0.10 in the prior year. Greenhouse gas emissions (Scope 1 and 2) totaled 27,183 metric tonnes of CO2 equivalent, with an emission intensity of 0.09 per rupee of turnover.
Water withdrawal increased to 23,894 kilolitres, driven by a rise in third-party water usage to 16,676 kilolitres from 8,491 kilolitres in FY25. The company implemented a Zero Liquid Discharge system across manufacturing locations. Waste generation rose to 21,760 metric tonnes, with hazardous waste constituting the majority at 18,409 metric tonnes.
Social and Governance Metrics
The company employed 227 permanent employees and engaged 469 workers (including 204 non-permanent workers) as of the end of FY26. Female representation among permanent employees stood at 11.01%, while female workers comprised 5.12% of the total workforce. The board included one woman director (16.67%), but no women were present in Key Management Personnel roles.
Turnover rates for permanent employees increased to 11.32% in FY26, up from 7.64% in FY25. Permanent worker turnover also rose sharply to 24.75% from 14.62%. The company reported zero fatalities and zero lost-time injuries for employees. Seven recordable work-related injuries were reported for workers, down from nine in the previous year.
What the Numbers Show
A notable divergence exists between capital deployment and related-party exposure. While investments in related parties decreased slightly to 89.64% of total investments from 99.50% in FY25, loans and advances to related parties remained at 100%. This indicates that while equity diversification may be occurring, all debt-like extensions continue to flow exclusively within the promoter group or associated entities.
Additionally, the concentration of purchases from trading houses fell significantly to 15% of total purchases from 57% in FY25. However, the top 10 trading houses now account for 92% of these reduced trading house purchases, up from 80%, suggesting a consolidation of supplier base despite lower overall reliance on traders.
Historical Stock Returns for Pondy Oxides & Chemical
| 1 Day | 5 Days | 1 Month | 6 Months | 1 Year | 5 Years |
|---|---|---|---|---|---|
| +3.06% | +11.97% | -3.00% | +16.11% | -7.13% | +617.50% |

How will the significant rise in non-renewable energy consumption and hazardous waste generation impact Pondy Oxides' long-term ESG ratings and access to green financing?
Given that 100% of loans and advances remain concentrated within related parties, what risks does this pose to minority shareholders regarding capital allocation efficiency and potential conflicts of interest?
With exports constituting 66% of turnover, how vulnerable is the company's revenue stream to potential shifts in global trade policies or tariffs on recycled metal products in its key markets?
 17
17






 Access Market Heat-map & Insights
  Create, Save & Share your Screener
  Use 200+ Screening Filters





