

Orbia reports 56% EBITDA growth in Q2 2026


Orbia Advance Corporation reported unaudited Q2 2026 results, with net revenues rising 20% to $2,352 million and EBITDA increasing 56% to $467 million. The company returned to profitability with a net income of $43 million, compared to a net loss of $100 million in the prior year, driven by growth across all business groups. Orbia raised its full-year 2026 EBITDA outlook to at least $1,200 million.

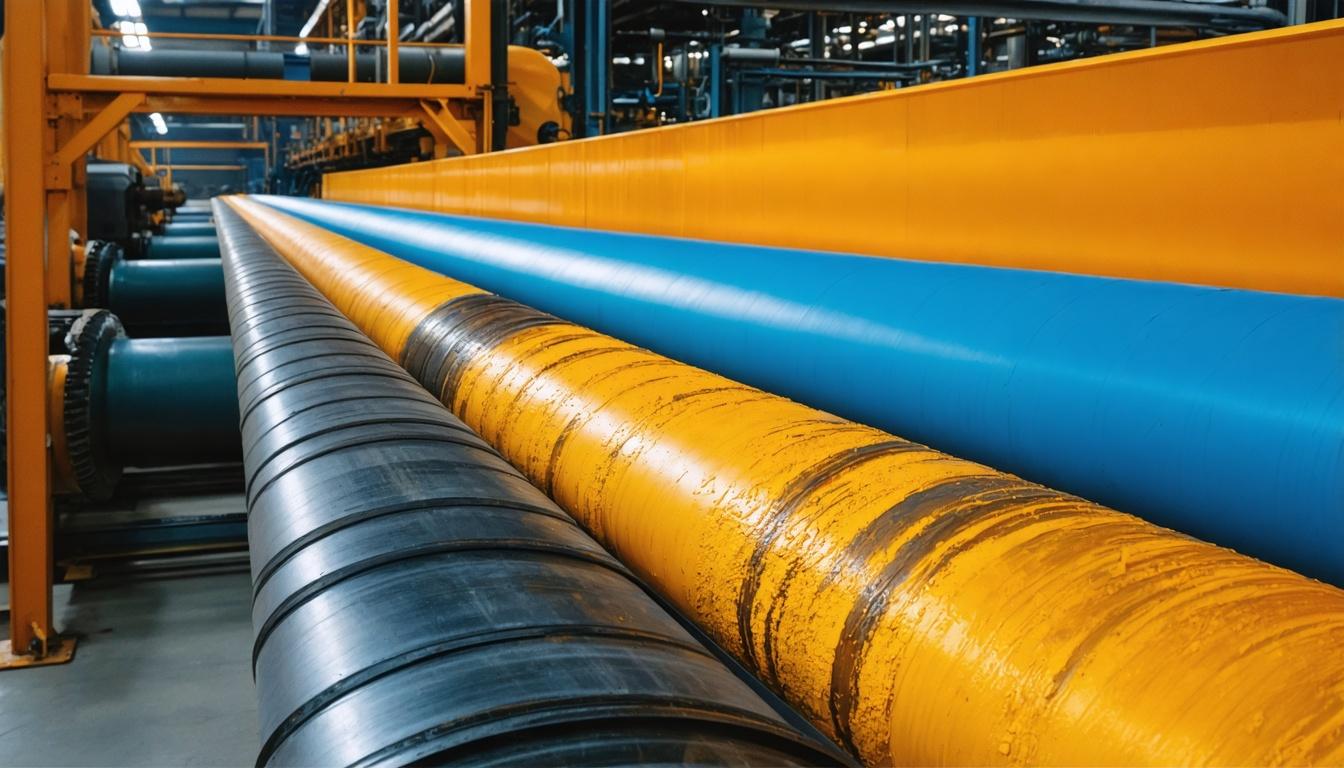

*this image is generated using AI for illustrative purposes only.
Orbia Advance Corporation, S.A.B. de C.V. reported unaudited financial results for the second quarter of 2026, demonstrating a return to profitability with a net income of $43 million compared to a net loss of $100 million in the prior year. The company achieved net revenues of $2,352 million, a 20% increase, and EBITDA of $467 million, a 56% rise, driven by higher sales across all business groups and strategic pricing actions.
Financial Performance
The company's operating income surged 121% to $304 million, while the EBITDA margin expanded by 463 basis points to 19.9%. Net majority income was $15 million, an improvement from a net loss of $126 million in the same quarter of the prior year. Operating cash flow improved by $15 million to $62 million, primarily due to higher EBITDA, partially offset by incremental working capital investments.
Segment Performance
All five business groups contributed to the revenue growth, with specific performance highlights including:
| Business Group | Q2 2026 Sales ($ million) | % Change | EBITDA ($ million) | % Change |
|---|---|---|---|---|
| Polymer Solutions | 773 | 25% | 144 | 82% |
| Building & Infrastructure | 725 | 15% | 113 | 79% |
| Fluor & Energy Materials | 329 | 33% | 114 | 58% |
| Precision Agriculture | 325 | 13% | 47 | 19% |
| Connectivity Solutions | 319 | 30% | 54 | 33% |
Polymer Solutions and Connectivity Solutions drove the EBITDA increase, supported by higher resin prices and strong demand in telecommunications and data center infrastructure. Building & Infrastructure and Fluor & Energy Materials also posted significant margin expansions due to proactive commercial actions and favorable product mixes.
Balance Sheet and Outlook
Orbia's net debt stood at $4,094 million, with a net debt-to-EBITDA ratio of 3.28x, an improvement from 3.64x in the previous quarter. The company held cash and cash equivalents of $900 million. Based on the strong performance, Orbia now expects full-year 2026 EBITDA of at least $1,200 million and capital expenditures of approximately $400 million.

How sustainable is the current pricing strategy in maintaining EBITDA margins if raw material costs fluctuate?
What specific measures will Orbia take to further reduce its net debt-to-EBITDA ratio below 3.0x?
Which business groups are expected to drive the most growth in the second half of 2026?
 16




 Access 50+ Readymade Screeners
 Use 200+ Custom Filters
 Get Full Market Insights





