

NMDC iron ore production rises 31% in July 2026


NMDC Limited reported iron ore production of 4.06 million MT in July 2026, a 31% YoY increase. Chhattisgarh led the growth with 2.55 million MT. Cumulative production reached 19.16 million MT, while cumulative sales stood at 15.15 million MT for the period up to July 2026.


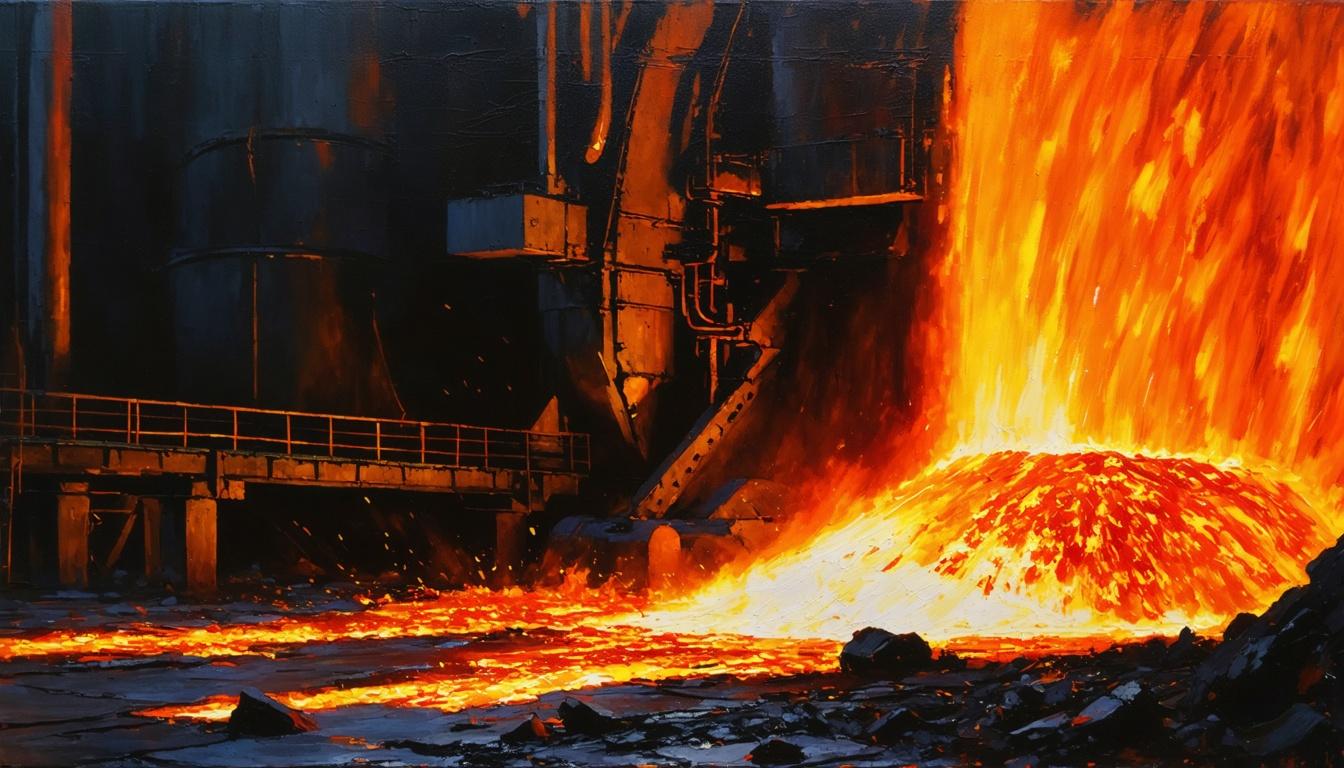
*this image is generated using AI for illustrative purposes only.
NMDC Limited reported a substantial rise in iron ore production for July 2026, with total output reaching 4.06 million metric tons (MT). This represents a 31% increase from the 3.09 million MT produced in July 2025. The growth underscores improved operational efficiency and higher extraction rates across its key mining regions during the first month of the fiscal year 2026-27 (FY27).
The disclosure was made pursuant to Regulation 30 of the SEBI (Listing Obligations and Disclosure Requirements) Regulations, 2015. The provisional data covers production and sales figures for the month of July 2026, providing early insight into the company’s performance trajectory for the new financial year.
Regional Performance Drivers
The surge in production was largely driven by the Chhattisgarh sector, which contributed 2.55 million MT in July 2026, up from 1.89 million MT in July 2025. This region remains the primary engine of NMDC’s output, accounting for over 60% of total monthly production. In contrast, the Karnataka sector saw a more modest increase, with production rising to 1.51 million MT from 1.20 million MT in the corresponding period last year.
| Sector | Monthly Production (MT) July 2026 | Monthly Production (MT) July 2025 | Cumulative Production (MT) Upto July 2026 | Cumulative Production (MT) Upto July 2025 |
|---|---|---|---|---|
| Chhattisgarh | 2.55 | 1.89 | 13.78 | 10.08 |
| Karnataka | 1.51 | 1.20 | 5.38 | 5.01 |
| Total | 4.06 | 3.09 | 19.16 | 15.09 |
Sales Dynamics
While production surged, sales volume experienced a slight contraction. Total sales in July 2026 stood at 3.40 million MT, down marginally from 3.46 million MT in July 2025. The Chhattisgarh sector recorded sales of 2.50 million MT, an increase from 2.15 million MT previously. However, this was offset by a decline in Karnataka sales, which fell to 0.90 million MT from 1.31 million MT.
Cumulative sales for the period up to July 2026 reached 15.15 million MT, surpassing the 14.98 million MT recorded in the same period of the previous fiscal year. This indicates that while monthly sales dipped slightly, the overall year-to-date delivery pace has remained robust.
What the Numbers Show
The divergence between the sharp rise in production and the slight dip in monthly sales suggests a potential build-up in inventory or a strategic shift in dispatch timing at the start of the new fiscal year. With cumulative production outpacing cumulative sales by a wider margin than in the previous year (19.16 million MT vs 15.15 million MT), NMDC appears to be positioning itself with higher stock levels to meet future demand or logistical requirements. The Chhattisgarh sector’s consistent outperformance highlights its critical role in sustaining the company’s overall volume growth.
Historical Stock Returns for NMDC
| 1 Day | 5 Days | 1 Month | 6 Months | 1 Year | 5 Years |
|---|---|---|---|---|---|
| +1.57% | -3.80% | -15.24% | -13.40% | -5.81% | +109.70% |

How will the growing inventory surplus from the production-sales divergence impact NMDC's pricing strategy and revenue realization in the coming quarters?
What specific operational challenges or regulatory factors might be causing the significant decline in Karnataka sector sales despite increased production?
Will NMDC need to expand its logistics and rail infrastructure capacity to handle the sustained higher output levels driven by the Chhattisgarh sector?







 Create Custom Screeners
  Access 200+ Pre-built Filters
  Use 50+ Readymade Screener





