

NCL Industries Q4 Results: Net profit surges 262% YoY to ₹661 crore


NCL Industries posted a consolidated net profit of ₹1,237 crore for FY26, up 263% YoY, driven by cement division strength and tax benefits. Revenue rose 4.4% to ₹14,220 crore. The Board declared a final dividend of ₹3.50 per share. The company also clarified filing discrepancies with NSE.


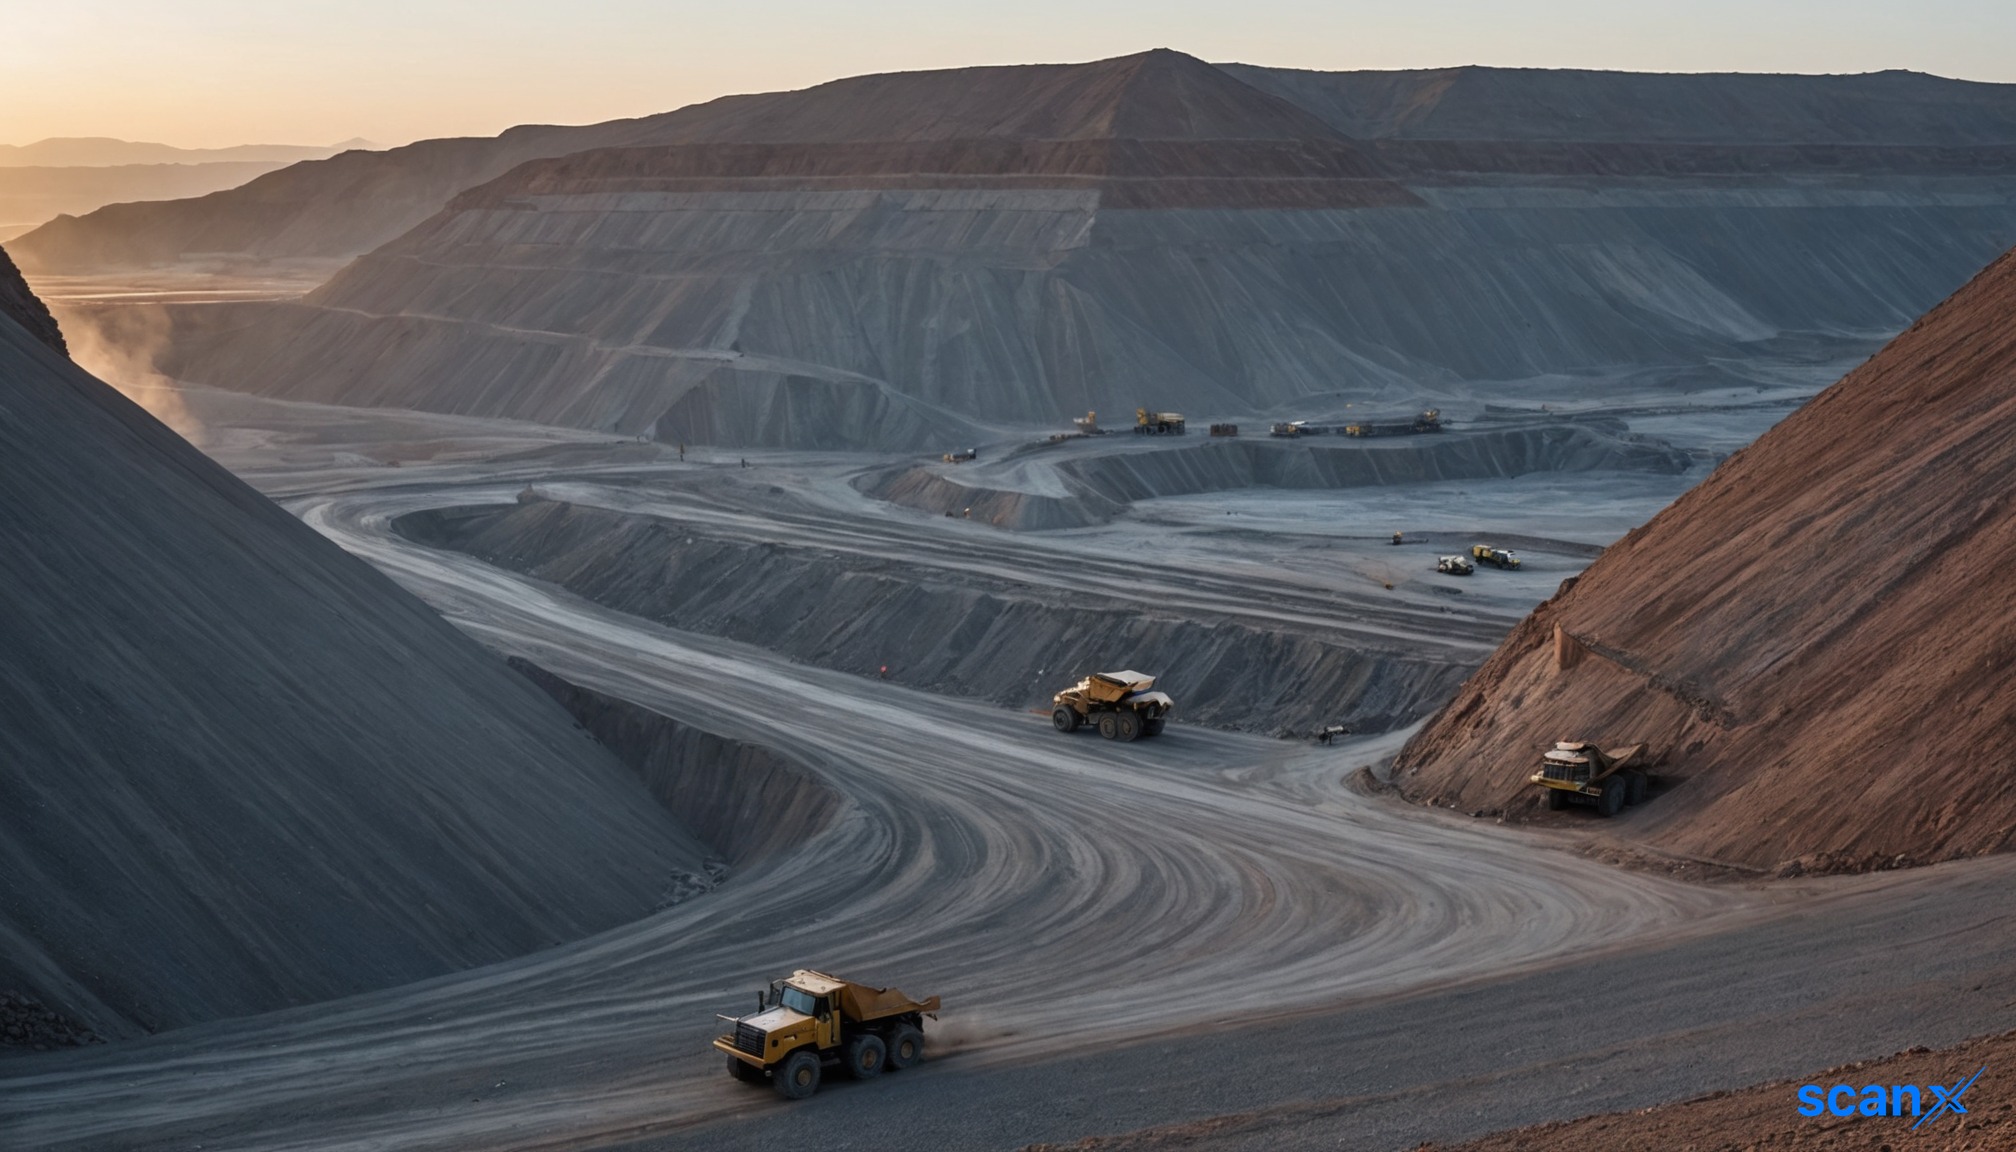
*this image is generated using AI for illustrative purposes only.
NCL Industries Limited reported a consolidated net profit of ₹1,237 crore for the financial year ended March 31, 2026, marking a 263% increase from ₹340 crore in FY25. The surge was primarily fueled by a 4.4% rise in total revenue from operations to ₹14,220 crore and substantial deferred tax credits that reduced the effective tax burden. For the fourth quarter alone, consolidated net profit from continuing operations reached ₹660 crore, compared to ₹96 crore in Q4FY25.
The results were approved by the Board of Directors on May 29, 2026, and audited by M. Bhaskara Rao & Co. In a separate communication dated July 24, 2026, the company addressed queries from the National Stock Exchange of India Limited regarding discrepancies between its XBRL and PDF filings under Regulation 33 of the SEBI (LODR) Regulations, 2015. NCL Industries stated there is no variation in the Profit After Tax figures across formats and requested specific field references to resolve the matter.
Financial Performance Highlights
| Metric | Consolidated Q4FY26 (₹ Cr) | Consolidated Q4FY25 (₹ Cr) | YoY Change | Consolidated FY26 (₹ Cr) | Consolidated FY25 (₹ Cr) |
|---|---|---|---|---|---|
| Revenue from Operations | 3,996 | 3,752 | 6.5% | 14,220 | 13,621 |
| Net Profit (Continuing Ops) | 660 | 96 | 583% | 12,374 | 3,405 |
| Earnings Per Share (Basic) | ₹15.14 | ₹2.08 | — | ₹27.89 | ₹7.48 |
| Total Comprehensive Income | 443 | 67 | 561% | 977 | 249 |
Standalone net profit for FY26 stood at ₹1,236 crore, up 261% year-on-year. Total income rose to ₹14,536 crore from ₹13,823 crore in the previous year. Other income increased significantly to ₹315 crore in FY26 from ₹202 crore in FY25, contributing to the bottom-line expansion.
Segment-Wise Performance
The Cement Division remained the primary growth engine, generating segment revenue of ₹15,000 crore for FY26, up 3.4% from ₹14,502 crore in FY25. The division’s profit before interest and tax (PBIT) surged to ₹13,965 crore from ₹5,659 crore, reflecting improved operational efficiency and pricing power.
Conversely, the Boards Division saw a decline in revenue to ₹1,633 crore from ₹2,061 crore, with PBIT dropping to ₹1,082 crore from ₹1,684 crore. The Ready Mix Concrete Division also recorded lower revenue of ₹1,308 crore against ₹1,480 crore in the prior year. The Energy Division contributed minimal revenue of ₹73 crore but posted a PBIT of ₹34 crore.
Discontinued Operations and Balance Sheet
The company classified its Doors Division as discontinued operations, recognizing an impairment loss of ₹2,575 crore on related assets. This resulted in a net loss from discontinued operations of ₹2,835 crore for FY26, compared to ₹88 crore in FY25. Consequently, total comprehensive income for the group was ₹977 crore.
On the balance sheet, total assets decreased slightly to ₹15,743 crore from ₹16,348 crore. Property, plant, and equipment grew to ₹11,088 crore, while inventories fell sharply to ₹1,480 crore from ₹2,481 crore. Borrowings were reduced to ₹23,656 crore (combining current and non-current) from ₹24,887 crore in the previous year.
What the Numbers Show
The dramatic improvement in profitability is largely attributable to favorable tax dynamics rather than pure operational margin expansion. While revenue grew modestly by 4.4%, the company benefited from a deferred tax credit of ₹1,930 crore in FY26, compared to a deferred tax expense of ₹42 crore in FY25. This shift significantly lowered the effective tax rate, boosting net profit margins. Additionally, exceptional items, including a ₹563 crore provision for mineral-bearing cess and a ₹414 crore diminution in joint venture investment value, impacted the overall result but did not offset the gains from continuing operations.
Historical Stock Returns for NCL Industries
| 1 Day | 5 Days | 1 Month | 6 Months | 1 Year | 5 Years |
|---|---|---|---|---|---|
| -1.44% | -1.73% | -5.72% | -9.39% | -19.81% | 0.0% |

How sustainable is NCL Industries' profitability given that the 263% net profit surge was primarily driven by a one-time ₹1,930 crore deferred tax credit rather than operational margin expansion?
What is the strategic roadmap for the Boards and Ready Mix Concrete divisions, which both posted declining revenues and PBITs, amid the overall group growth?
Will the massive ₹2,575 crore impairment loss on the discontinued Doors Division signal a broader restructuring of NCL's asset portfolio or exit from non-core segments?
 19
19






 Create Custom Screeners
  Access 200+ Pre-built Filters
  Use 50+ Readymade Screener





