

JTL Industries FY26: Record Revenue ₹21,364 Mn; Q4 EBITDA Surges 224% YoY


JTL Industries reported its highest-ever annual revenue of ₹21,364 Mn for FY26, with EBITDA rising 25.6% YoY to ₹1,544 Mn and PAT up 4.3% YoY to ₹1,031 Mn. Q4 FY26 was equally strong, with revenue of ₹6,927 Mn (+47.5% YoY), EBITDA of ₹577 Mn (+224% YoY), and PAT of ₹379 Mn (+125.2% YoY). The board recommended a dividend of ₹0.125 per share, while consolidated total assets grew to ₹1,99,627.62 lakhs as at March 31, 2026.


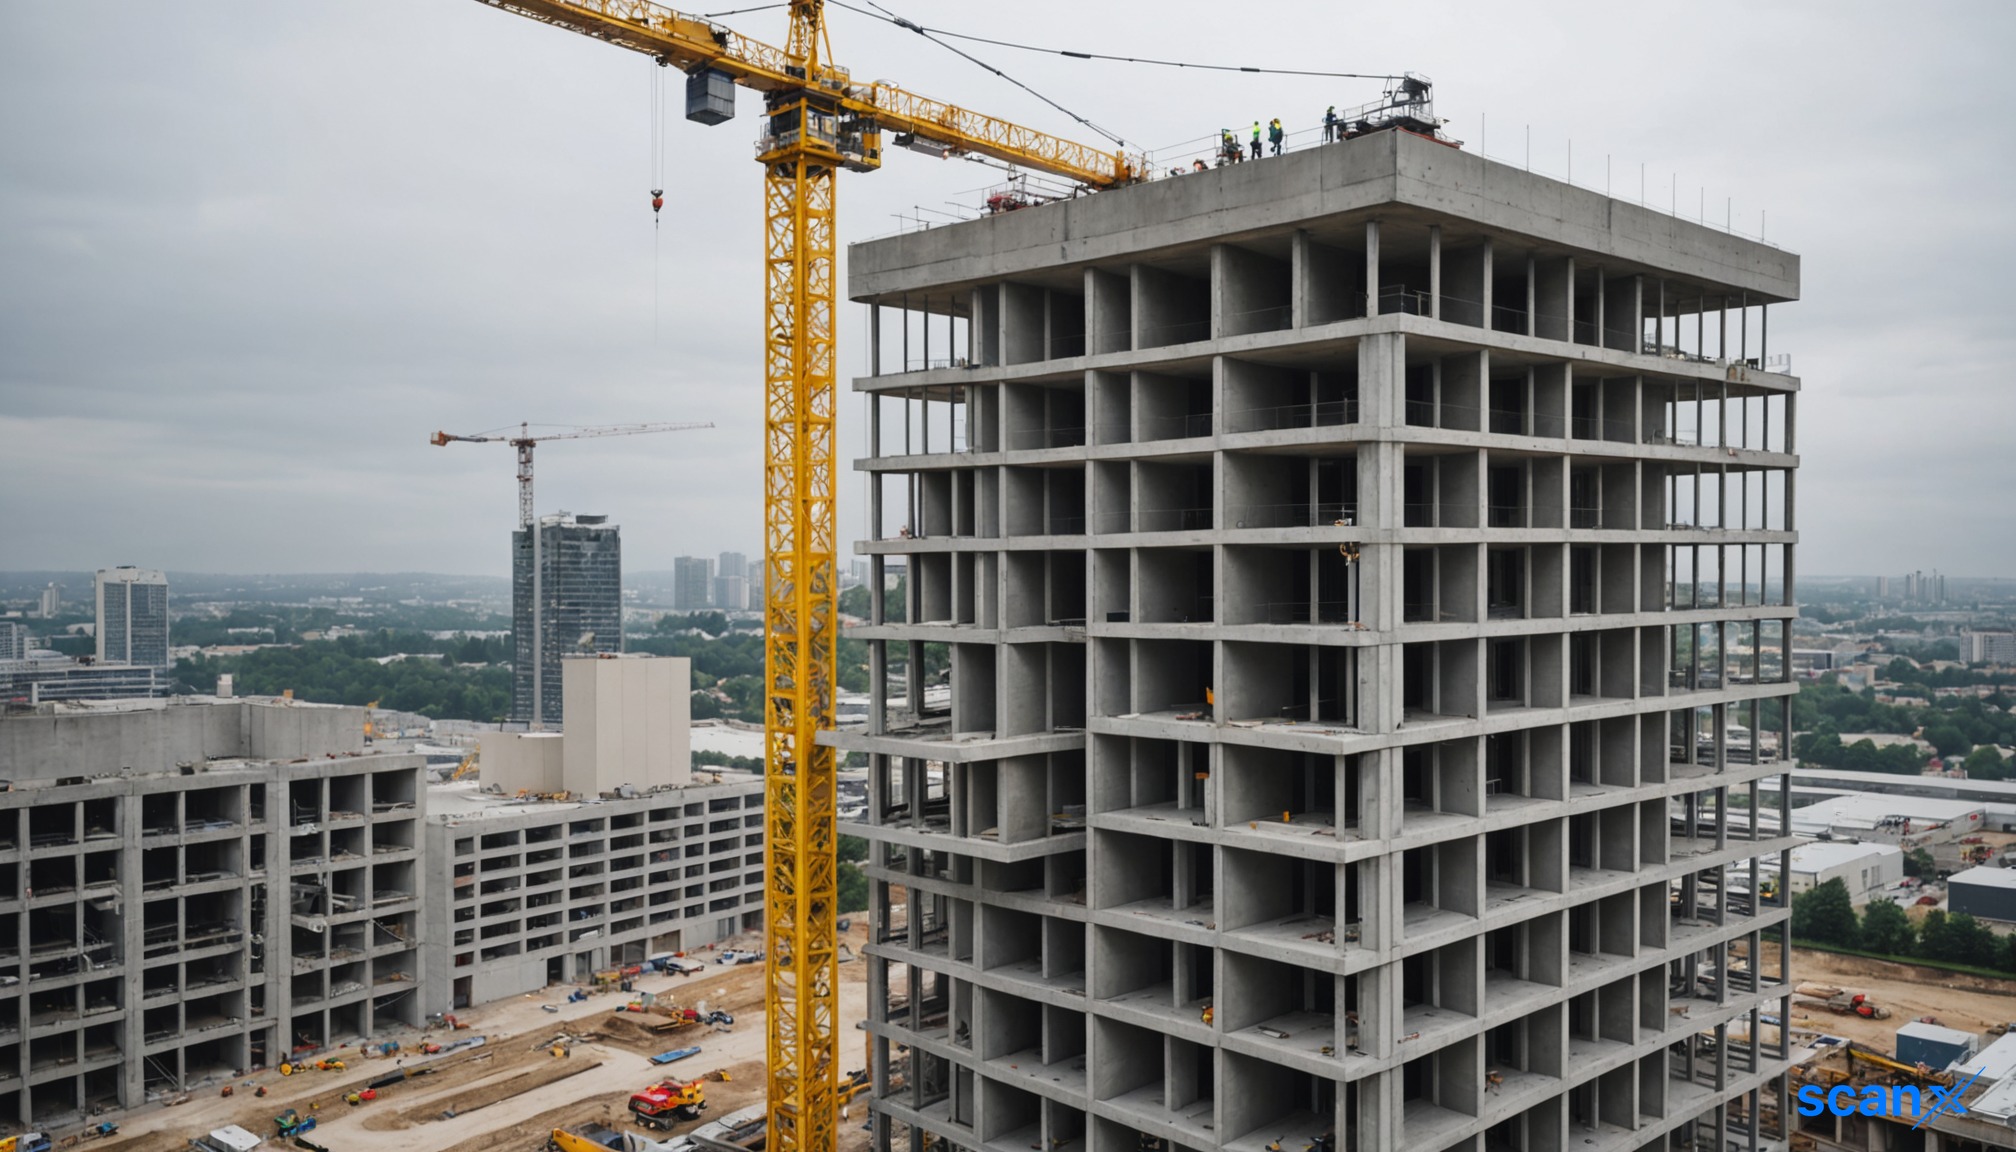
*this image is generated using AI for illustrative purposes only.
JTL Industries Limited's Board of Directors, at its meeting held on May 11, 2026, approved the standalone and consolidated audited financial results for the quarter and financial year ended March 31, 2026, pursuant to Regulation 30 and 33 of the SEBI (Listing Obligations and Disclosure Requirements) Regulations, 2015. The meeting commenced at 12:30 PM and concluded at 02:20 PM. The statutory auditors, N Kumar Chhabra and Co., Chartered Accountants (ICAI Firm Registration Number 000837N), issued audit reports with unmodified opinions on both standalone and consolidated financial results. The announcement was communicated by Amrender Kumar Yadav, Company Secretary and Compliance Officer. An earnings presentation on the audited financial results for Q4 and FY26 was also filed under Regulation 30 of SEBI (Listing Obligations and Disclosure Requirements) Regulations, 2015, on May 11, 2026. Subsequently, the audio recording of the Analysts/Investor Conference Call on the audited financial results, held on May 11, 2026, was uploaded on the company's website at www.jtl.one . No unpublished price sensitive information (UPSI) was discussed during the call.
Management Commentary
Managing Director Mr. Madan Mohan Singla described FY26 as a landmark year for JTL Industries, stating that the company delivered its highest-ever annual revenue and sales volumes, supported by strong demand across infrastructure and industrial segments, improved operational efficiencies, and higher utilization across facilities. Revenue from operations for FY26 stood at ₹21,364 Mn, reflecting growth of 11.5% YoY, while EBITDA increased by 25.6% YoY to ₹1,544 Mn. Annual sales volumes for FY26 reached 3,95,900 MT, supported by capacity ramp-up, improved product mix, and increasing contribution from value-added products. In Q4 FY26, the company reported its highest-ever quarterly revenue and sales volumes, driven by strong execution across domestic and export markets. Revenue from operations stood at ₹6,927 Mn, reflecting growth of 47.5% YoY and 47.2% QoQ, while EBITDA stood at ₹577 Mn, registering strong growth of 224.0% YoY and 49.5% QoQ. EBITDA per ton improved significantly to ₹4,685 during the quarter, supported by better realizations, operational efficiencies, and higher contribution from value-added products. Profit after tax for Q4 FY26 stood at ₹379 Mn, reflecting growth of 125.2% YoY and 42.9% QoQ. The quarter witnessed strong momentum in DFT structural steel pipes and export sales, supported by growing market acceptance and enhanced capacity utilization at the Mangaon facility. With increasing focus on value-added products, operational efficiencies, and export expansion, the company remains well positioned to strengthen its market presence and drive long-term sustainable growth.
Quarterly Financial Performance
The following table presents key quarterly financial metrics for JTL Industries:
| Metric: | Q4 FY26 | Q3 FY26 | Q4 FY25 |
|---|---|---|---|
| Revenue from Operations (₹ Mn): | 6,927 | 4,705 | 4,695 |
| EBITDA (₹ Mn): | 577 | 386 | 178 |
| EBITDA Margin (%): | 8.3% | 8.2% | 3.8% |
| EBITDA/Ton (₹): | 4,685 | 4,247 | 2,129 |
| PAT (₹ Mn): | 379 | 265 | 168 |
| PAT Margin (%): | 5.5% | 5.6% | 3.5% |
Q4 FY26 revenue grew 47.5% YoY and 47.2% QoQ, while EBITDA surged 224.0% YoY and 49.5% QoQ. EBITDA/ton increased 120.0% YoY and 10.3% QoQ. PAT grew 125.2% YoY and 42.9% QoQ.
Annual Financial Performance
The following table presents key annual financial metrics:
| Metric: | FY26 | FY25 | Change (%) |
|---|---|---|---|
| Revenue from Operations (₹ Mn): | 21,364 | 19,163 | +11.5% |
| EBITDA (₹ Mn): | 1,544 | 1,230 | +25.6% |
| EBITDA Margin (%): | 7.2% | 6.4% | — |
| EBITDA/Ton (₹): | 3,900 | 3,538 | +10.2% |
| PAT (₹ Mn): | 1,031 | 988 | +4.3% |
| PAT Margin (%): | 4.8% | 5.2% | — |
| ROCE: | 8.6% | — | — |
Operational Performance
JTL Industries demonstrated strong volume growth across both the quarter and the full year. The following table summarises key operational metrics:
| Metric: | Q4 FY26 | Q3 FY26 | Q4 FY25 | FY26 | FY25 |
|---|---|---|---|---|---|
| Sales Volume (MT): | 1,23,262 | 90,429 | 81,885 | 3,95,900 | 3,45,690 |
| Export Volume (MT): | 11,785 | 9,592 | 6,841 | 37,301 | 33,700 |
| Export Contribution: | ~10.6% | — | — | ~10.4% | — |
Q4 FY26 sales volume grew 50.5% year-on-year, while FY26 full-year volumes rose 14.5% year-on-year. Export volumes for Q4 FY26 increased 72.3% year-on-year. The company operates 6 manufacturing facilities with an installed capacity of 1.0 Mn TPA and maintains a presence across 20+ countries spanning 5 continents.
Standalone Financial Performance
On a standalone basis, the company operates in one reportable business segment — manufacturing of Steel Tubes, Pipes and Structures. The following table presents key standalone financial results (₹ in Lakhs):
| Metric: | Q4 FY26 (Audited) | Q3 FY26 (Unaudited) | Q4 FY25 (Audited) | FY26 (Audited) | FY25 (Audited) |
|---|---|---|---|---|---|
| Revenue from Operations: | 50,041.47 | 42,290.07 | 46,606.50 | 1,79,837.62 | 1,91,290.69 |
| Other Income: | 184.15 | 386.77 | 895.51 | 1,409.45 | 2,255.93 |
| Total Income: | 50,225.62 | 42,676.85 | 47,502.01 | 1,81,247.07 | 1,93,546.62 |
| Total Expenses: | 46,785.93 | 39,439.83 | 45,269.61 | 1,69,744.87 | 1,80,387.99 |
| Profit Before Tax: | 3,439.69 | 3,237.02 | 2,232.40 | 11,502.20 | 13,158.63 |
| Total Tax Expenses: | 830.58 | 636.15 | 555.04 | 2,714.35 | 3,277.89 |
| Profit for the Period: | 2,609.11 | 2,600.87 | 1,677.36 | 8,787.86 | 9,880.74 |
| Total Comprehensive Income: | 2,423.28 | 2,554.27 | 903.87 | 8,521.43 | 8,856.70 |
| Basic EPS (₹): | 0.66 | 0.66 | 0.43 | 2.24 | 2.60 |
| Diluted EPS (₹): | 0.66 | 0.66 | 0.38 | 2.24 | 2.30 |
As at March 31, 2026, standalone total assets stood at ₹1,55,981.26 lakhs, with total equity at ₹1,30,054.70 lakhs. Paid-up equity share capital remained at ₹3,930.82 lakhs, with other equity at ₹1,26,123.88 lakhs.
Consolidated Financial Performance
The consolidated results include wholly owned subsidiary JTL Tubes Limited, subsidiaries JTL Engineering Limited and JTL Defence Limited (erstwhile RCI Industries and Technologies Limited), and associate Powersol Metalcraft Limited. During the year, JTL Industries acquired a majority stake in JTL Defence Limited pursuant to an NCLT order dated October 09, 2025, and now holds 95% of its share capital. The key consolidated financial results are presented below (₹ in Lakhs):
| Metric: | Q4 FY26 (Audited) | Q3 FY26 (Unaudited) | Q4 FY25 (Audited) | FY26 (Audited) | FY25 (Audited) |
|---|---|---|---|---|---|
| Revenue from Operations: | 69,268.18 | 47,051.71 | 46,946.92 | 2,13,636.36 | 1,91,631.11 |
| Other Income: | 131.58 | 364.62 | 884.40 | 1,268.72 | 2,244.82 |
| Total Income: | 69,399.76 | 47,416.34 | 47,831.32 | 2,14,905.07 | 1,93,875.93 |
| Total Expenses: | 64,448.95 | 44,111.53 | 45,592.90 | 2,01,390.72 | 1,80,714.73 |
| Profit Before Tax: | 4,954.53 | 3,304.81 | 2,238.42 | 13,518.07 | 13,161.20 |
| Total Tax Expenses: | 1,168.56 | 656.08 | 555.87 | 3,212.36 | 3,278.68 |
| Profit for the Period: | 3,785.97 | 2,648.73 | 1,682.55 | 10,305.71 | 9,882.52 |
| Total Comprehensive Income: | 17,759.30 | 2,602.13 | 909.06 | 24,198.44 | 8,858.48 |
| Basic EPS (₹): | 0.96 | 0.67 | 0.43 | 2.62 | 2.60 |
| Diluted EPS (₹): | 0.96 | 0.67 | 0.38 | 2.62 | 2.30 |
The consolidated total assets as at March 31, 2026 stood at ₹1,99,627.62 lakhs, compared to ₹1,33,909.82 lakhs as at March 31, 2025. Total equity on a consolidated basis was ₹1,52,175.55 lakhs, with equity attributable to shareholders of the holding company at ₹1,48,660.46 lakhs and non-controlling interests at ₹3,515.09 lakhs. The subsidiaries collectively reported total assets of ₹55,543.19 lakhs, revenue from operations of ₹40,325.93 lakhs, net profit after tax of ₹1,514.14 lakhs, and total comprehensive income of ₹15,673.30 lakhs for the year ended March 31, 2026. Associate Powersol Metalcraft Limited contributed a share of profit after tax of ₹3.71 lakhs to the consolidated results.
Standalone Balance Sheet Highlights
Key balance sheet figures on a standalone basis as at March 31, 2026 are presented below (₹ in Lakhs):
| Parameter: | March 31, 2026 | March 31, 2025 |
|---|---|---|
| Total Non-Current Assets: | 53,213.78 | 38,537.93 |
| Total Current Assets: | 1,02,767.48 | 92,926.61 |
| Total Assets: | 1,55,981.26 | 1,31,464.54 |
| Total Equity: | 1,30,054.70 | 1,21,784.32 |
| Total Non-Current Liabilities: | 571.42 | 373.25 |
| Total Current Liabilities: | 25,355.14 | 9,306.97 |
Cash Flow Summary
On a standalone basis, net cash used in operating activities was ₹(968.10) lakhs for the year ended March 31, 2026, compared to ₹(21,479.42) lakhs in the prior year. Net cash used in investing activities was ₹(15,550.06) lakhs, while net cash from financing activities was ₹13,291.03 lakhs. Standalone cash and cash equivalents at the end of the year stood at ₹3,338.65 lakhs, down from ₹6,565.78 lakhs at the beginning of the year. On a consolidated basis, net cash used in operating activities was ₹(6,737.32) lakhs, net cash used in investing activities was ₹(14,195.45) lakhs, and net cash from financing activities was ₹16,965.04 lakhs. Consolidated cash and cash equivalents at year-end stood at ₹3,475.23 lakhs, compared to ₹7,442.96 lakhs at the start of the year. The auditor's consolidated report included an Emphasis of Matter regarding certain aspects related to the Corporate Insolvency Resolution Process (CIRP) of JTL Defence Limited and its subsequent acquisition, where the financial impact, if any, is presently not ascertainable; however, the opinion is not qualified in respect of this matter.
Dividend and Other Board Decisions
The Board recommended an equity dividend of ₹0.125 per share (face value of ₹1 each, i.e., @ 12.50%) for the financial year ended March 31, 2026, subject to declaration by the members at the 35th AGM. If declared, the dividend shall be paid to shareholders within 30 days of declaration at the ensuing Annual General Meeting. Additionally, the Board approved the appointment of M/s. Vikas Kshitij & Associates, Chartered Accountants (FRN: 043524N), Chandigarh, as Internal Auditors for FY 2026-27, and the re-appointment of M/s Balwinder & Associates, Cost Accountants (FRN: 000201) as Cost Auditors for FY 2026-27.
About JTL Industries Limited
JTL Industries Limited is among the fastest-growing steel tube manufacturers, with its registered office situated in Chandigarh. The company operates manufacturing facilities in Punjab, Maharashtra, Chhattisgarh, and Himachal Pradesh (including its subsidiaries). Its cumulative pipe manufacturing capacity is approximately 9,36,000 MTPA, with around 3,00,000 MTPA dedicated to backward integration. The company is a recognized Three Star Export House. Its product range includes DFT Structural Pipes, GI Pipes, MS Black Pipes, Hollow Sections, Solar Structures, HR Coils, and Phosphorous Bronze, Copper and Brass Alloys, among others, which cater to various industrial and infrastructural applications.
Historical Stock Returns for JTL Industries
| 1 Day | 5 Days | 1 Month | 6 Months | 1 Year | 5 Years |
|---|---|---|---|---|---|
| +4.98% | +4.20% | +5.89% | +27.69% | +26.42% | -62.31% |

How will JTL Defence Limited's integration impact consolidated margins and revenue mix over the next 2-3 years, given the unresolved CIRP-related financial uncertainties flagged by auditors?
With export volumes growing 72.3% YoY in Q4 FY26 and the company present in 20+ countries, which geographies or product segments are expected to drive the next phase of export expansion?
Given that standalone operating cash flow remains negative and current liabilities nearly tripled YoY, how does JTL Industries plan to manage its working capital and liquidity position in FY27?
 17
17





 Access 50+ Readymade Screeners
  Use 200+ Custom Filters
  Get Full Market Insights





