

J Kumar Infraprojects files FY26 annual report ahead of September AGM


- J Kumar Infraprojects reported FY26 consolidated revenue of ₹5,723 crore with a 14.4% EBITDA margin
- Operating cash flow surged to ₹1,128 crore from ₹376 crore in FY25 due to better working capital management
- Total order book stood at ₹18,554 crore as on March 31, 2026, with post-year-end wins adding ₹4,556 crore
- The board proposed a final dividend of ₹4 per share for FY26



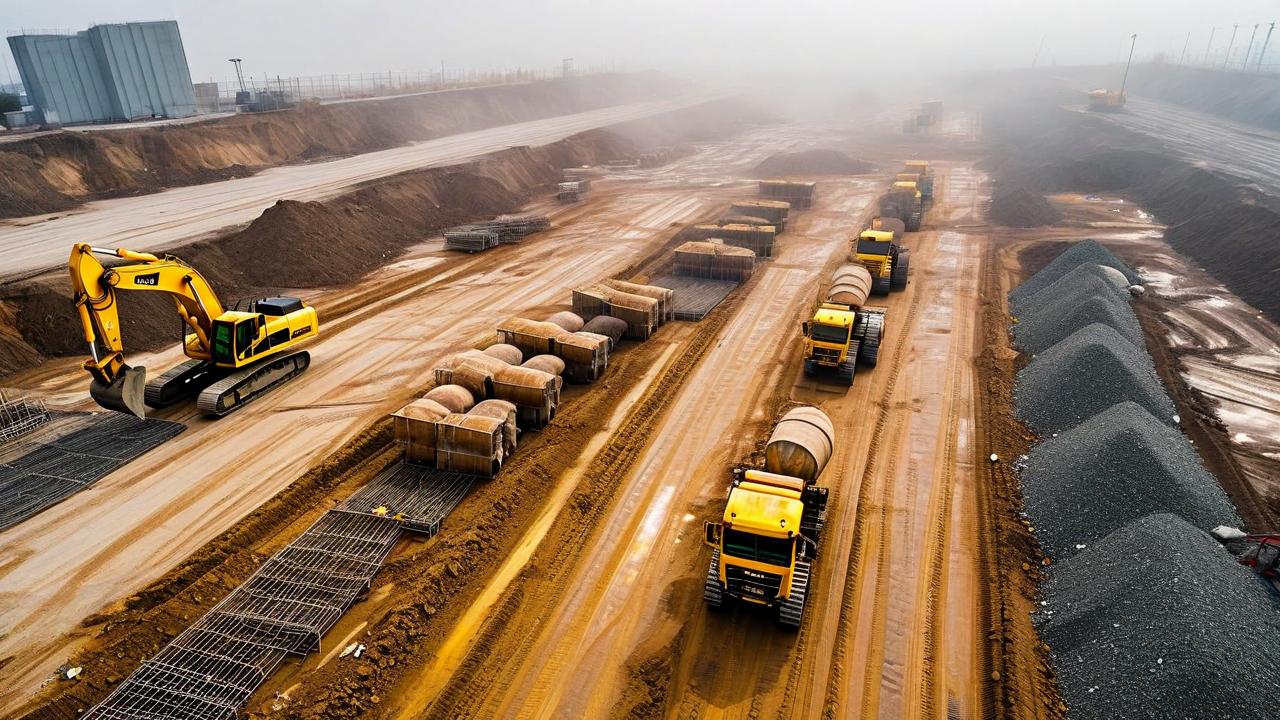
*this image is generated using AI for illustrative purposes only.
J Kumar Infraprojects filed its FY26 annual report and AGM notice on August 27, 2026, reporting consolidated revenue of ₹5,723 crore, an EBITDA margin of 14.4%, and a total order book of ₹18,554 crore as on March 31, 2026.
The company's 27th Annual General Meeting is scheduled for Tuesday, September 22, 2026, at 11:00 am at Vaishnavi Banquets, Vile Parle (East), Mumbai. The Board has proposed a final dividend of ₹4 per equity share for FY26, payable to shareholders on record as of Tuesday, September 15, 2026. The register of members and share transfer books will remain closed from September 16 to September 22, 2026.
FY26 Financial Performance
FY26 was marked by steady margins and significantly improved cash conversion, even as revenue growth remained modest. The following table summarises key consolidated financial metrics.
| Metric | FY26 | FY25 |
|---|---|---|
| Revenue from Operations (₹ crore) | 5,723 | 5,693 |
| EBITDA (₹ crore) | 823 | 826 |
| EBITDA Margin (%) | 14.4 | 14.5 |
| Profit After Tax (₹ crore) | 387 | 391 |
| Cash PAT (₹ crore) | 583 | 560 |
| Net Cash from Operations (₹ crore) | 1,128 | 376 |
| Working Capital Days | 99 | 112 |
| Net Cash Position (₹ crore) | 264 | — |
| Gross Debt-Equity Ratio (x) | 0.18 | 0.23 |
| Basic & Diluted EPS (₹) | 51.13 | 51.70 |
Operating cash flow rose to ₹1,128 crore from ₹376 crore in FY25, driven by tighter collections, improved inventory management, and reduced working capital days. Capital expenditure during FY26 was approximately ₹500 crore, directed primarily towards tunnel boring machines for the Goregaon-Mulund Link Road, the Chennai casting yard, and fleet requirements.
Five-Year Performance Trajectory
The company's five-year financial history reflects a revenue CAGR of 12.9% and a PAT CAGR of 17.0%, with EBITDA margins remaining in a narrow band of 14.2%–14.5%.
| Year | Revenue (₹ crore) | PAT (₹ crore) | EBITDA Margin (%) |
|---|---|---|---|
| FY26 | 5,723 | 387 | 14.4 |
| FY25 | 5,693 | 391 | 14.5 |
| FY24 | 4,879 | 331 | 14.4 |
| FY23 | 4,203 | 274 | 14.2 |
| FY22 | 3,527 | 206 | 14.3 |
Order Book and Segment Mix
The total order book stood at ₹18,554 crore as on March 31, 2026. Elevated corridors and flyovers represented the largest share at 51%, followed by roads and road tunnels at 18%, civil and other infrastructure at 15%, and metro projects at 12% combined.
| Segment | Order Book Share (%) | Revenue Share FY26 (%) |
|---|---|---|
| Elevated Corridors / Flyovers | 51 | 29 |
| Roads / Road Tunnels | 18 | 25 |
| Civil & Others | 15 | 12 |
| Metro – Elevated | 6 | 18 |
| Metro – Underground | 6 | 11 |
| Water | 4 | 5 |
Geographically, Maharashtra accounted for 63% of the order book, followed by Tamil Nadu at 18% and Delhi & NCR at 15%. Post year-end, the company secured orders worth ₹4,556 crore and held L1 positions worth ₹2,490 crore by May 2026, taking combined visibility close to ₹25,000 crore.
FY26 Order Wins
Contracts awarded during FY26 totalled ₹1,039 crore across five packages.
| Project | Authority | Value (₹ crore) |
|---|---|---|
| Multi-modal Integration at 8 Metro Stations, Mumbai Metro Line 4 & 4A (Pkg-1) | MMRDA, Maharashtra | 68 |
| Foot Over Bridge, Mumbai Metro Line 4 & 4A, Pkg-2 | MMRDA, Maharashtra | 77 |
| Twin Tunnel, Film City Goregaon to Mulund (Pkg-1) | BMC, Maharashtra | 120 |
| Twin Tunnel, Film City Goregaon to Mulund (Pkg-2) | BMC, Maharashtra | 252 |
| GPRA Colony Redevelopment, Netaji Nagar, New Delhi | NBCC (India) Limited | 522 |
| Total | 1,039 |
Key Resolutions at the AGM
The agenda for the 27th AGM includes the following ordinary and special business items:
- Adoption of standalone and consolidated audited financial statements for the financial year ended March 31, 2026.
- Declaration of a final dividend of ₹4 per equity share of face value ₹5 each for FY26.
- Reappointment of Mr. Pravin Ghag as Executive Director, who retires by rotation.
- Appointment of M/s. S P M L & Associates, Chartered Accountants (Firm Registration No. 136549W), as statutory auditors for a five-year term from the conclusion of the 27th AGM to the 32nd AGM, at a proposed remuneration of ₹50 lakhs for FY27, excluding taxes and out-of-pocket expenses.
- Ratification of remuneration of ₹8,00,000 payable to M/s. Kirit Mehta & Co. LLP as cost auditors for the financial year ending March 31, 2027.
Auditor Transition
M/s. Todi Tulsyan & Co., which served as statutory auditors since the 22nd AGM in 2021, will complete its two consecutive terms upon the conclusion of this AGM. The Board has proposed M/s. S P M L & Associates as the incoming statutory auditors. The firm has over three decades of experience in audit, taxation, and financial advisory, holds a valid Peer Review Board certificate from ICAI, and is registered with CAG and RBI as a Category I firm.
Voting Process
Remote e-voting will be open from Saturday, September 19, 2026, at 9:00 am to Monday, September 21, 2026, at 5:00 pm via NSDL. Shareholders on record as of the cut-off date of Tuesday, September 15, 2026, are eligible to vote. Mr. Dhrumil M. Shah of Dhrumil M. Shah & Co. LLP has been appointed as scrutinizer for the voting process.
A speaker registration window will be activated on September 16, 2026, at 9:00 am and will close on September 21, 2026, at 5:00 pm. The company reserves the right to restrict the number of questions and speakers based on time availability.
Credit Profile and ESG Highlights
The company holds an ICRA A+/Positive rating for both fund-based and non-fund-based facilities, with total rated limits of ₹5,916.46 crore. On the ESG front, CSR expenditure for FY26 stood at ₹950.40 lakhs against a statutory obligation of ₹899.76 lakhs. The company employed 6,955 permanent employees as on March 31, 2026, and achieved 100% employee training coverage. Safety recognitions during the year included the IIN Platinum Award 2025 for best HSE practices at Mumbai Metro Lines 9 and 7A, and seven million safe man-hours at the Mumbai Metro Line 7A project.
Source: https://lodr-files.dhan.co/lodr-inputs/Company/INE576I01022/4876e7fd-e7dc-44ce-b46b-eea7813a560f.pdf
Historical Stock Returns for J Kumar Infraprojects
| 1 Day | 5 Days | 1 Month | 6 Months | 1 Year | 5 Years |
|---|---|---|---|---|---|
| -0.16% | -6.58% | -11.70% | -9.05% | -33.22% | +134.74% |

How will the significant shift in revenue mix towards Elevated Corridors and Flyovers (51% of order book) impact J Kumar Infraprojects' EBITDA margins compared to its historical 14.2%-14.5% range?
Given the ₹500 crore capital expenditure on tunnel boring machines and casting yards, what is the expected timeline for these assets to contribute to revenue, and how will this affect near-term free cash flow?
With Maharashtra accounting for 63% of the order book, what are the company's specific strategies to mitigate regional concentration risk and accelerate order acquisition in Tamil Nadu and Delhi-NCR?
 19
19





 Access Market Heat-map & Insights
  Create, Save & Share your Screener
  Use 200+ Screening Filters





