

J Kumar Infraprojects files FY26 BRSR report with safety and ESG metrics


- J Kumar Infraprojects filed its FY26 BRSR report on August 27, 2026
- Turnover reached ₹5,723.03 crore with net worth at ₹3,368.21 crore
- Scope 1 emissions rose to 43,320.4 MT CO2e while Scope 2 fell to 7,771.74 MT
- Total waste generated increased to 574,749.1 MT due to improved tracking
- Company maintained zero Lost Time Injury Frequency Rate for employees

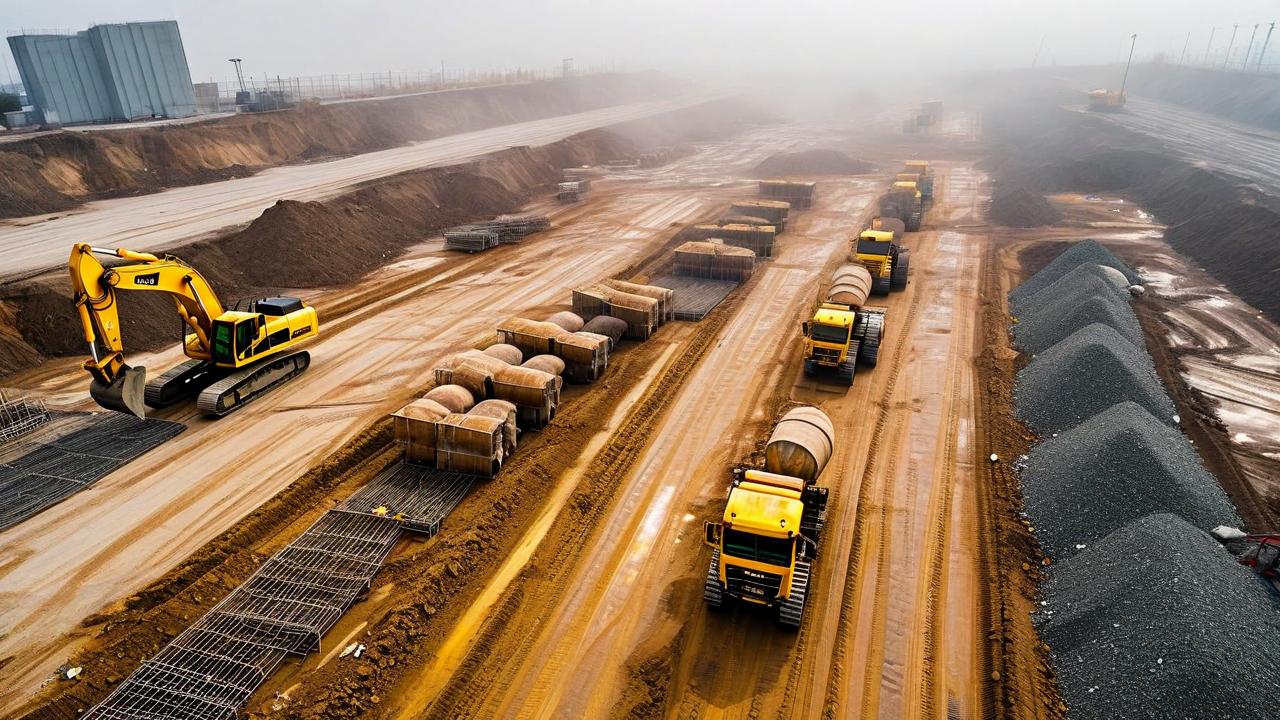

*this image is generated using AI for illustrative purposes only.
J Kumar Infraprojects Limited filed its Business Responsibility and Sustainability Report (BRSR) for FY26 on August 27, 2026, outlining its environmental and social governance performance.
The Mumbai-based infrastructure developer reported a turnover of ₹5,723.03 crore and a net worth of ₹3,368.21 crore during the financial year. The company operates across seven states, executing projects primarily for government and public sector clients.
What the Numbers Show
The company’s total energy consumption rose to 622,152 Giga Joules in FY26 from 600,028 Giga Joules in FY25. This increase coincided with a rise in Scope 1 greenhouse gas emissions to 43,320.4 metric tonnes of CO2 equivalent, up from 41,118.83 metric tonnes in the previous year. Conversely, Scope 2 emissions fell significantly to 7,771.74 metric tonnes from 10,877.26 metric tonnes, indicating a divergence between direct operational emissions and indirect energy-related emissions.
Safety and Employee Metrics
J Kumar Infraprojects maintained a Lost Time Injury Frequency Rate (LTIFR) of zero for employees in FY26, consistent with FY25. The company employed 6,955 permanent staff, of whom 97.07% were male. Female representation stood at 2.93%, with women comprising 12.5% of the Board of Directors and 16.67% of Key Managerial Personnel.
| Metric | FY26 | FY25 |
|---|---|---|
| Total Employees | 6,955 | 7,364 |
| Female Representation | 2.93% | 2.78% |
| LTIFR (Employees) | 0 | 0 |
| Turnover Rate (Total) | 25.46% | 21.92% |
Environmental Impact
The company consumed 582,544 kilolitres of water in FY26, an increase from 573,891 kilolitres in FY25. Waste generation figures saw a substantial revision due to improved tracking methodologies. Total waste generated was recorded at 574,749.1 metric tonnes, compared to 1.07 metric tonnes in FY25. Of this, 198.5 metric tonnes were recovered through recycling or reuse.
| Environmental Metric | FY26 | FY25 |
|---|---|---|
| Water Consumption (KL) | 582,544 | 573,891 |
| Scope 1 Emissions (MT CO2e) | 43,320.4 | 41,118.83 |
| Scope 2 Emissions (MT CO2e) | 7,771.74 | 10,877.26 |
| Total Waste Generated (MT) | 574,749.1 | 1.07 |
Governance and Compliance
The company reported no fines, penalties, or regulatory actions related to corruption or conflicts of interest during the reporting period. It conducted 159 training programs for employees covering occupational health, safety, and responsible workplace practices. Additionally, 520 awareness programs were held for value chain partners, covering 98% of business value.
Historical Stock Returns for J Kumar Infraprojects
| 1 Day | 5 Days | 1 Month | 6 Months | 1 Year | 5 Years |
|---|---|---|---|---|---|
| -0.16% | -6.58% | -11.70% | -9.05% | -33.22% | +134.74% |

How will J Kumar Infraprojects plan to mitigate the rising Scope 1 emissions and total energy consumption in FY27 given the expansion of its project portfolio?
What specific strategies is the company implementing to address the high employee turnover rate of 25.46% and improve retention in a competitive infrastructure labor market?
Given the low female representation of 2.93% among permanent staff, what targeted initiatives are planned to increase gender diversity at the operational level beyond boardroom metrics?
 17
17






 Access 50+ Readymade Screeners
  Use 200+ Custom Filters
  Get Full Market Insights





