

Itron Inc. Q2 Results: Adjusted EPS beats estimates despite revenue miss


Itron Inc. delivered a profitable second quarter with adjusted EPS of $1.59, beating estimates, though revenue fell 7.2% to $562.9 million. Margin expansion drove profitability gains, leading the company to raise full-year EPS guidance to $6.30-$6.50. Backlog remains robust at $4.4 billion, but near-term revenue expectations are tempered.


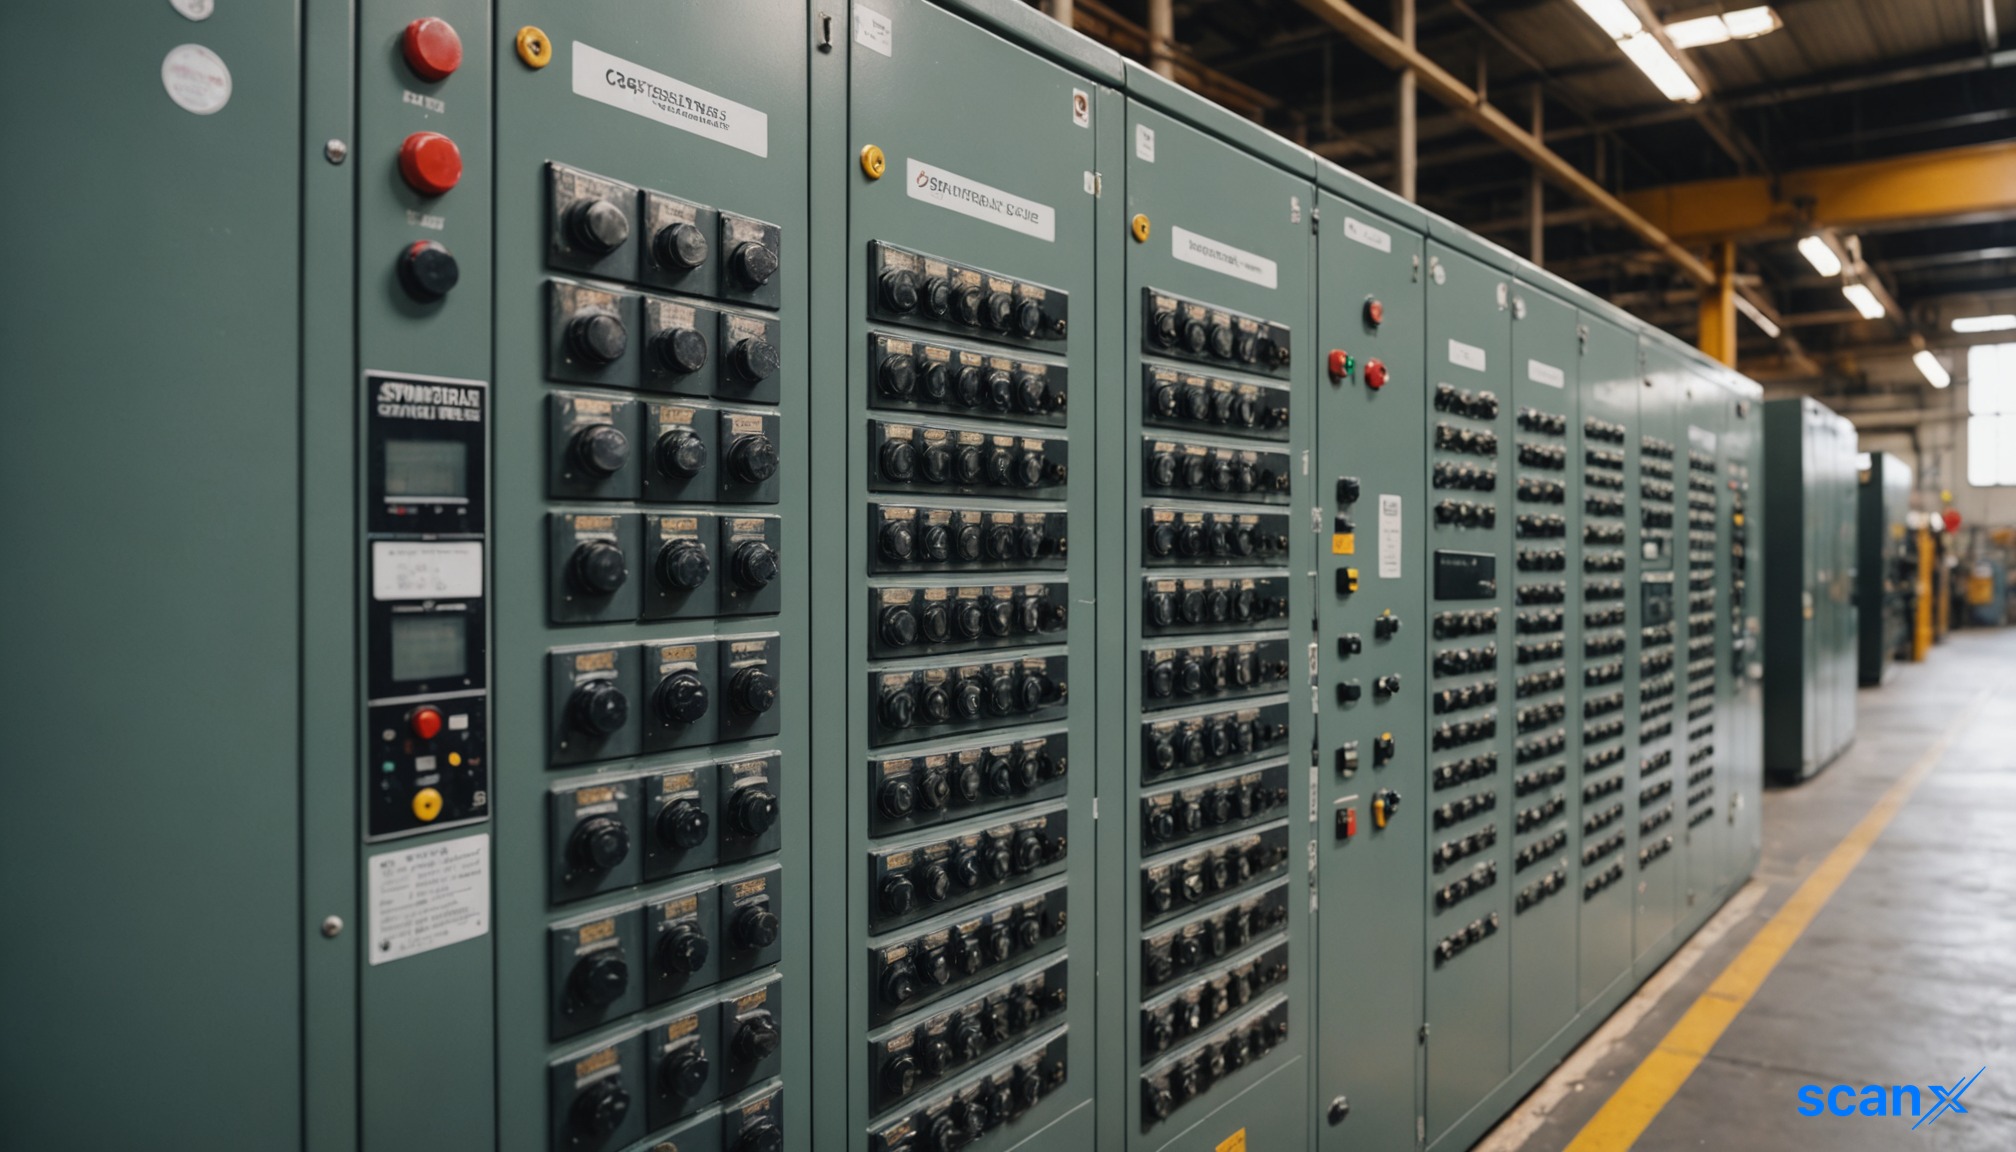
*this image is generated using AI for illustrative purposes only.
Itron Inc. (NASDAQ: ITRI) reported second-quarter adjusted earnings per share of $1.59, beating analyst estimates of $1.29, although revenue fell 7.2% year over year to $562.9 million, missing the $566.1 million forecast. The divergence between strong profitability metrics and declining top-line growth reflects a strategic shift toward higher-margin services and operational cost discipline, even as project deployment timing weighed on overall sales volume.
GAAP diluted EPS declined to $1.19 from $1.47 in the prior year period, while net income attributable to Itron fell 22% to $53.3 million. This decline was primarily driven by lower interest income and a higher effective tax rate. Despite the GAAP headwinds, adjusted gross margin expanded by 460 basis points to 41.4%, supported by favorable product and customer mix, operational efficiencies, and strict cost management.
Segment Performance
Revenue performance varied significantly across business segments. Device Solutions revenue decreased slightly by 1.2% to $111.4 million, while its adjusted operating margin improved substantially to 28.3% from 22.6%. Networked Solutions saw a sharper decline, with revenue dropping 17% to $339.2 million due to project deployment timing and lower volumes; however, its adjusted operating margin rose to 33% from 29.6%. Outcomes revenue grew 13.3% to $96.4 million, driven by higher services revenue, with an adjusted operating margin of 21.3%. Resiliency Solutions generated $15.8 million in revenue with a 27.7% adjusted operating margin.
| Segment | Revenue | Change | Adj. Op. Margin |
|---|---|---|---|
| Device Solutions | $111.4 million | -1.2% | 28.3% |
| Networked Solutions | $339.2 million | -17% | 33% |
| Outcomes | $96.4 million | +13.3% | 21.3% |
| Resiliency Solutions | $15.8 million | N/A | 27.7% |
Cash Flow and Balance Sheet
Operating cash flow stood at $88.1 million, resulting in free cash flow of $81.5 million for the quarter. Bookings totaled $550 million, contributing to a backlog that ended the quarter at $4.4 billion. Annual recurring revenue increased 21% to $417 million, indicating growing stability in service-based income streams. Itron closed the quarter with $745 million in cash and cash equivalents against $1.61 billion in debt, excluding amortization of debt fees.
What the Numbers Show
The financial results highlight a clear trade-off between revenue scale and profitability quality. While total revenue contracted, the expansion in adjusted gross margins across all segments suggests that Itron is successfully optimizing its product mix toward higher-value offerings. The 21% surge in annual recurring revenue further underscores this transition, providing a more predictable earnings base even as one-time project deployments fluctuate. Investors should monitor whether this margin expansion can be sustained as revenue guidance remains below market expectations.
Outlook
For the third quarter, Itron expects adjusted EPS of $1.50-$1.60, compared to the $1.54 estimate, and revenue of $590 million-$600 million, which is below the $607.7 million estimate. The company raised its full-year adjusted EPS guidance to $6.30-$6.50 from the previous range of $5.75-$6.25, surpassing the $5.96 estimate. Full-year revenue guidance was narrowed to $2.37 billion-$2.41 billion from $2.35 billion-$2.45 billion, compared to the $2.388 billion estimate. Shares of Itron traded lower on Wednesday, down 4.91% to $101.76, as investors digested the mixed signals from the revenue outlook.

How sustainable is Itron's margin expansion strategy if the broader utility sector continues to delay capital expenditure projects?
What specific operational levers is management using to offset the 17% revenue decline in Networked Solutions while maintaining high operating margins?
Will the $1.61 billion debt load constrain Itron's ability to pursue strategic acquisitions as it pivots toward higher-margin recurring revenue streams?
 20
20






 Create Custom Screeners
  Access 200+ Pre-built Filters
  Use 50+ Readymade Screener





