

Indokem Q1FY27 net profit surges 53% on margin expansion


Indokem Ltd's Q1FY27 results show consolidated net profit at ₹10.7 crore, up from ₹7.0 crore YoY, with revenue growing to ₹469.2 crore. Standalone profit also surged to ₹8.6 crore from ₹3.3 crore, reflecting strong operational efficiency.


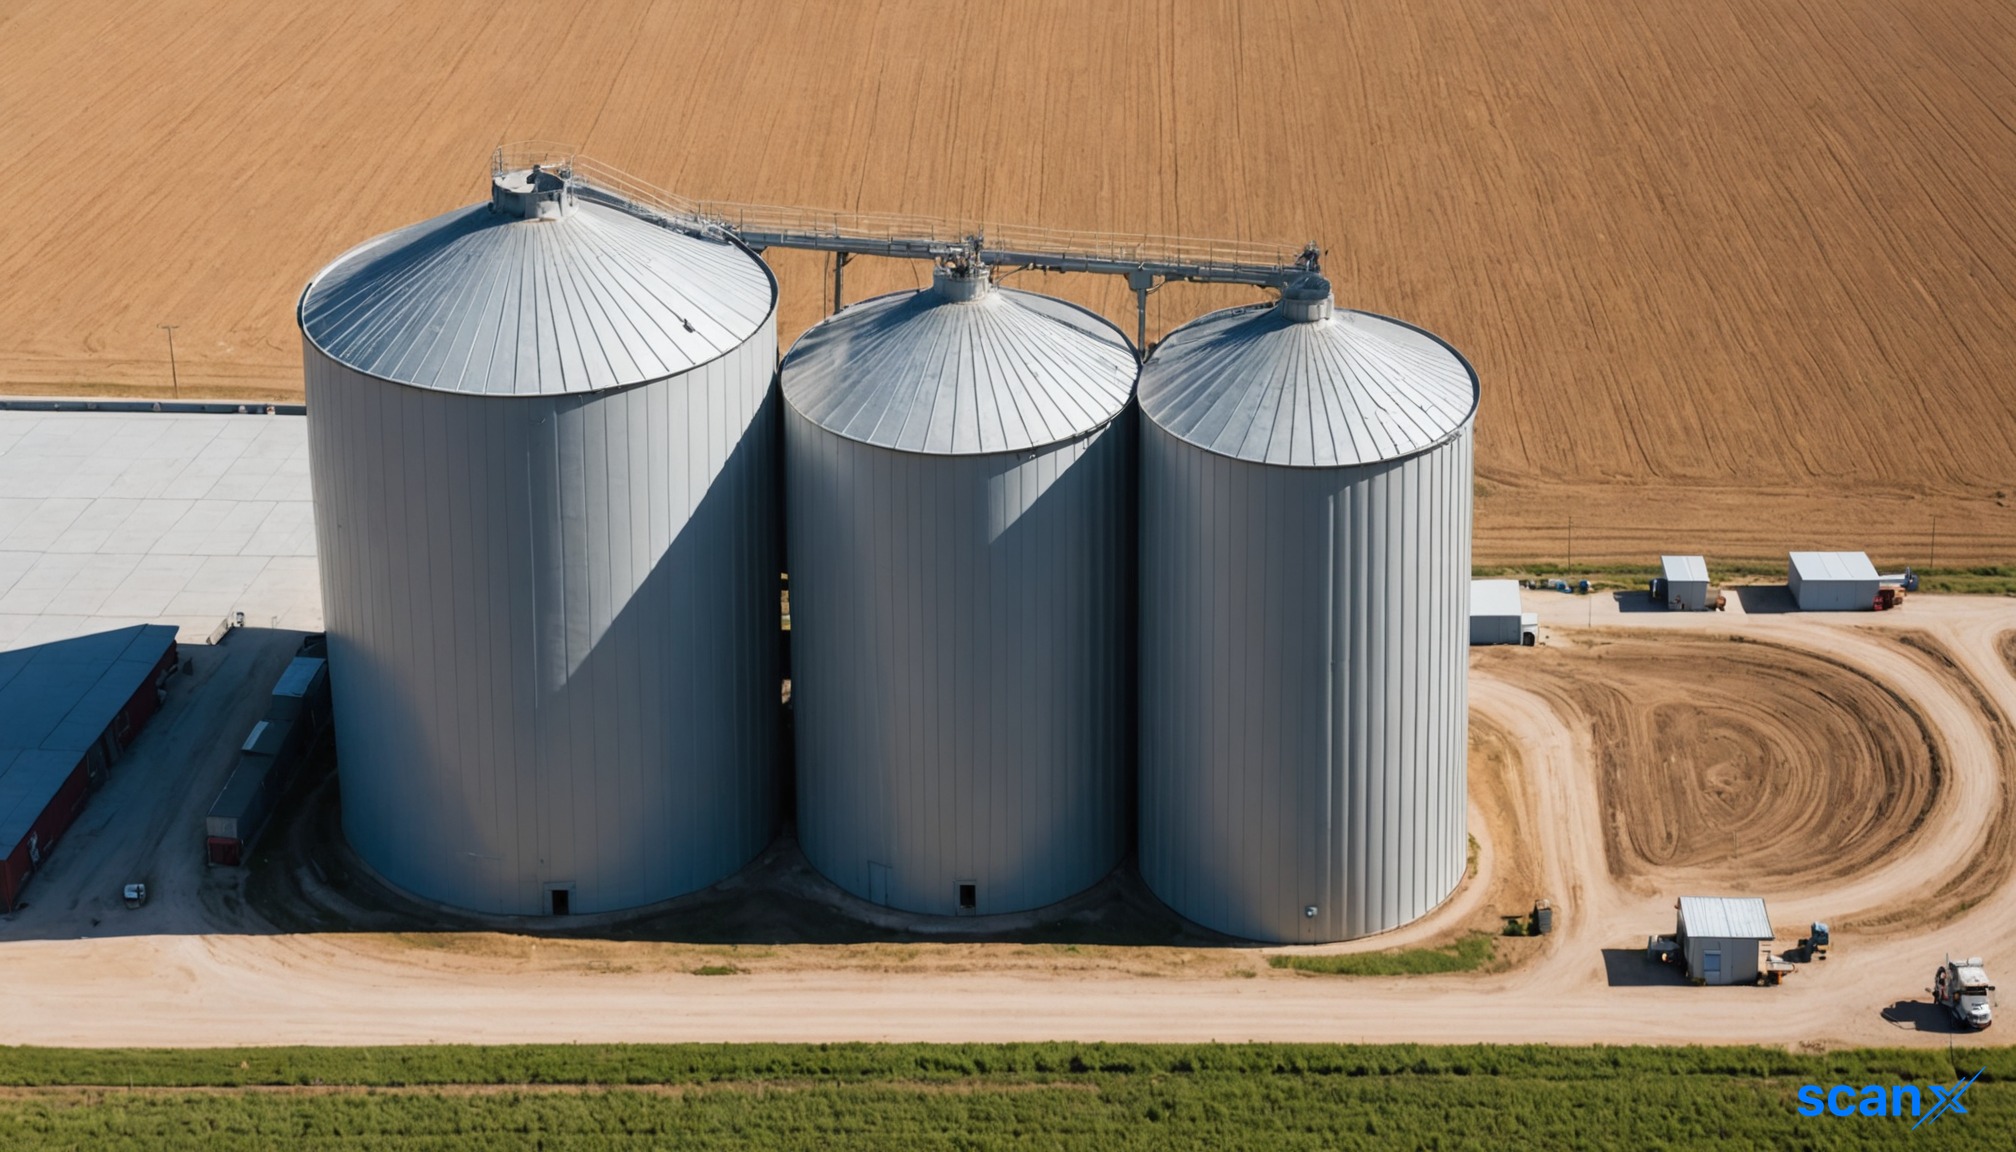
*this image is generated using AI for illustrative purposes only.
Indokem reported a significant improvement in its consolidated financial results for the quarter ended June 30, 2026 (Q1FY27), with net profit rising 53% year-on-year to ₹10.7 crore. The Mumbai-based chemical manufacturer posted total income from operations of ₹469.2 crore, up from ₹417.4 crore in the corresponding period of the previous year, reflecting robust top-line growth alongside improved operational efficiency.
The Board of Directors approved the unaudited consolidated financial results in a meeting held on July 31, 2026, pursuant to Regulation 47 of the SEBI (Listing Obligations and Disclosure Requirements) Regulations, 2015. The results were subsequently published in Business Standard and Mumbai Lakshdeep on August 1, 2026. Indokem’s statutory auditor reviewed the quarterly figures before board approval.
Financial Performance Highlights
Indokem’s consolidated net profit for Q1FY27 stood at ₹10.7 crore, compared to ₹7.0 crore in Q1FY26. Profit before tax increased to ₹10.8 crore from ₹7.0 crore in the year-ago quarter. The company’s earnings per share (EPS) rose to ₹0.38 per share, up from ₹0.25 per share in Q1FY26.
Revenue from operations grew by approximately 12.4% to ₹469.2 crore. This top-line expansion was supported by higher volumes and stable pricing in key chemical segments. The company’s standalone revenue also saw growth, reaching ₹427.3 crore against ₹364.6 crore in the prior year quarter.
Margin Expansion and Operational Efficiency
A key driver of the improved profitability was the expansion in operating margins. While specific EBITDA figures were not explicitly broken out in the extract, the widening gap between revenue and pre-tax profit indicates enhanced cost management. In Q1FY26, profit before tax was ₹7.0 crore on revenue of ₹417.4 crore, implying a pre-tax margin of roughly 1.68%. In Q1FY27, this margin expanded to approximately 2.30% (₹10.8 crore on ₹469.2 crore revenue).
The following table summarises Indokem’s key consolidated financial metrics for Q1FY27:
| Metric | Q1FY27 (Unaudited) | Q1FY26 (Unaudited) | YoY Change |
|---|---|---|---|
| Total Income from Operations | ₹469.2 Cr | ₹417.4 Cr | +12.4% |
| Profit Before Tax | ₹10.8 Cr | ₹7.0 Cr | +54.3% |
| Net Profit After Tax | ₹10.7 Cr | ₹7.0 Cr | +52.9% |
| EPS (Basic & Diluted) | ₹0.38 | ₹0.25 | +52.0% |
Standalone Results
On a standalone basis, Indokem reported a net profit of ₹8.6 crore for Q1FY27, compared to ₹3.3 crore in Q1FY26. Standalone revenue from operations was ₹427.3 crore, up from ₹364.6 crore. The standalone profit before tax also rose to ₹8.6 crore from ₹3.3 crore, highlighting strong performance across both consolidated and standalone entities.
What the Numbers Show
The nearly 53% jump in net profit outpaces the 12.4% revenue growth, signalling operational leverage. The expansion in pre-tax margins from ~1.68% to ~2.30% suggests that Indokem is effectively managing input costs or benefiting from a more favourable product mix. With paid-up equity capital remaining stable at ₹278.9 crore, the improved earnings translate directly into higher returns for shareholders, as evidenced by the 52% rise in EPS. Investors should monitor whether this margin expansion is sustainable in subsequent quarters given the volatile nature of chemical raw material prices.
Historical Stock Returns for Indokem
| 1 Day | 5 Days | 1 Month | 6 Months | 1 Year | 5 Years |
|---|---|---|---|---|---|
| -10.64% | +2.55% | -1.32% | +4.83% | +4.83% | +4.83% |

Can Indokem sustain its expanded pre-tax margins of 2.30% in Q2FY27 amidst the inherent volatility of chemical raw material prices?
What specific operational strategies or cost-management initiatives contributed to the significant divergence between revenue growth (12.4%) and profit growth (53%)?
How does Indokem plan to allocate the increased earnings, and are there indications of upcoming dividend payouts or capital expenditure projects?
 17
17






 Access Market Heat-map & Insights
  Create, Save & Share your Screener
  Use 200+ Screening Filters





