

Imperial Oil Q2 EPS of $4.52 beats $4.06 estimate despite sales miss


Imperial Oil's Q2 2026 EPS of $4.52 exceeded analyst estimates of $4.06, driven by higher commodity prices and refining margins. Despite a 22.30% miss on revenue estimates, net income rose 131% YoY to $2,190 million.

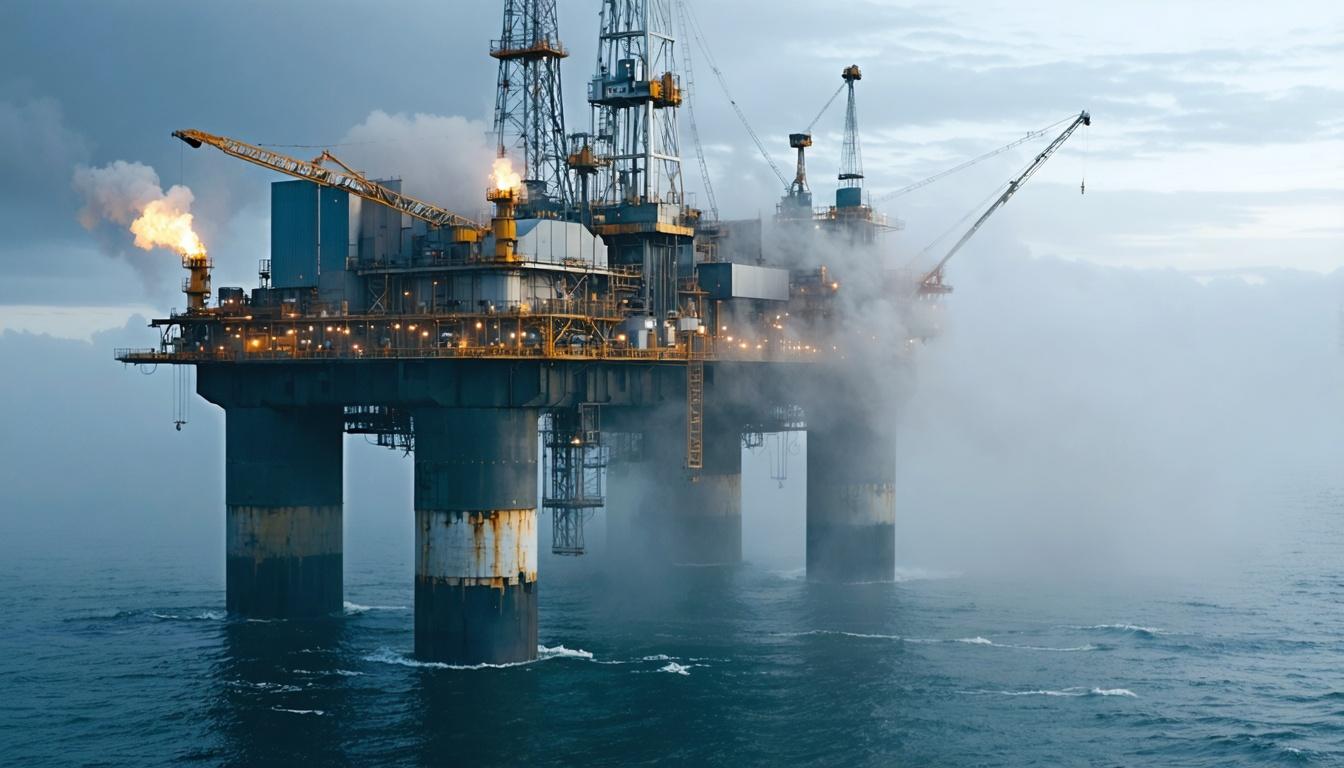

*this image is generated using AI for illustrative purposes only.
Imperial Oil Limited reported second quarter 2026 earnings per share (EPS) of $4.52, surpassing the analyst consensus estimate of $4.06 by 11.33 percent. The Toronto-based energy giant’s net income surged to $2,190 million, up from $949 million in the prior year period, driven primarily by higher commodity prices and improved refining margins. However, total revenues and other income reached $16,062 million, missing the analyst consensus estimate of $20,673 million by 22.30 percent. This revenue figure represents a 43 percent increase over the $11,232 million reported in the second quarter of 2025.
Chairman, President and Chief Executive Officer John Whelan attributed the strong financial performance to the company’s advantaged integrated structure, which delivered results across Upstream, Downstream and Chemical segments even as it completed significant planned maintenance work. Imperial returned $421 million to shareholders through dividends in the quarter and declared a third quarter dividend of $0.87 per share, alongside a renewed annual normal course issuer bid (NCIB) allowing the repurchase of up to five percent of its outstanding common shares over the next 12 months.
Financial Performance Highlights
The company’s profitability surged due to favorable price realizations, with average bitumen realizations increasing by $29.97 per barrel and synthetic crude oil realizations rising by $53.25 per barrel compared to the prior year period. Net income per common share, assuming dilution, stood at $4.52, compared to $1.86 in the previous year. Operating cash flows from activities totaled $2,704 million, excluding working capital impacts of $182 million.
| Metric | Q2 2026 | Q2 2025 | Change |
|---|---|---|---|
| Net Income ($ million) | 2,190 | 949 | +$1,241 |
| Diluted EPS ($) | 4.52 | 1.86 | +$2.66 |
| Operating Cash Flow ($ million) | 2,704 | 1,465 | +$1,239 |
| Capital Expenditures ($ million) | 531 | 473 | +$58 |
Segment Operations and Production
Upstream production averaged 414,000 gross oil-equivalent barrels per day, slightly down from 427,000 barrels per day in the second quarter of 2025, due to lower volumes at Kearl and Syncrude. At Kearl, total gross production averaged 257,000 barrels per day (182,000 barrels Imperial’s share), impacted by the absence of exceptional high-quality ore grade versus the prior year. Cold Lake production increased to 149,000 barrels per day from 145,000 barrels per day, supported by strong performance of solvent-assisted SAGD technology at Grand Rapids.
In the Downstream segment, refinery throughput averaged 331,000 barrels per day, resulting in capacity utilization of 76 percent, down from 87 percent in the prior year due to planned turnaround work at the Strathcona refinery and unplanned downtime. Petroleum product sales averaged 446,000 barrels per day. Imperial updated its 2026 refinery throughput guidance to 370,000–380,000 barrels per day and utilization to 85–88 percent, reflecting short-term rail logistic challenges at Strathcona targeted for resolution by year end.
What the Numbers Show
The divergence between rising profitability and declining production volumes highlights Imperial’s pricing power and margin resilience in the current market environment. While upstream volumes dipped due to operational factors like ore grade variations at Kearl and rainfall impacts at Syncrude, the substantial increase in bitumen and synthetic crude realizations more than compensated for the volume decline. This dynamic underscores the sensitivity of Imperial’s earnings to commodity price movements, where higher marker prices and improved spreads drove a $1,010 million positive price impact on upstream net income, offsetting a $120 million negative volume impact. The miss on revenue estimates contrasts with the beat on EPS, indicating that margin expansion rather than volume growth was the primary driver of shareholder value in this period.
Liquidity and Shareholder Returns
Cash flows from investing activities totaled $(470) million, primarily reflecting additions to property, plant and equipment offset by proceeds from asset sales. Financing activities used $(424) million, largely due to dividend payments. The company did not purchase any shares under the NCIB program in the second quarter but plans to accelerate purchases to complete the program prior to year end. Total assets stood at $47,863 million at June 30, 2026, with total debt at $3,988 million.

How might the resolution of Strathcona refinery rail logistics by year-end impact Imperial's ability to meet its updated 2026 throughput guidance of 370,000–380,000 barrels per day?
Given the significant revenue miss despite an EPS beat, will investors prioritize margin expansion over volume growth in their valuation models for integrated energy giants?
What is the strategic rationale behind accelerating NCIB share repurchases in Q4, and how might this affect capital allocation priorities for long-term upstream projects?
 17









 Access Market Heat-map & Insights
 Create, Save & Share your Screener
 Use 200+ Screening Filters





