HLE Glascoat FY26 Revenue Rises 31.7% to ₹1,353 Cr


HLE Glascoat Limited announced its audited financial results for the year ended March 31, 2026, reporting a 31.7% year-on-year increase in consolidated revenue to ₹1,353.0 crore. Profit After Tax (PAT) for the year stood at ₹56.6 crore with a margin of 4.2%, while EBITDA rose 5.4% to ₹148.5 crore. The Board recommended a final dividend of ₹1.10 per share, and the company maintained a strong order book of ₹681.6 crore as of March 31, 2026.


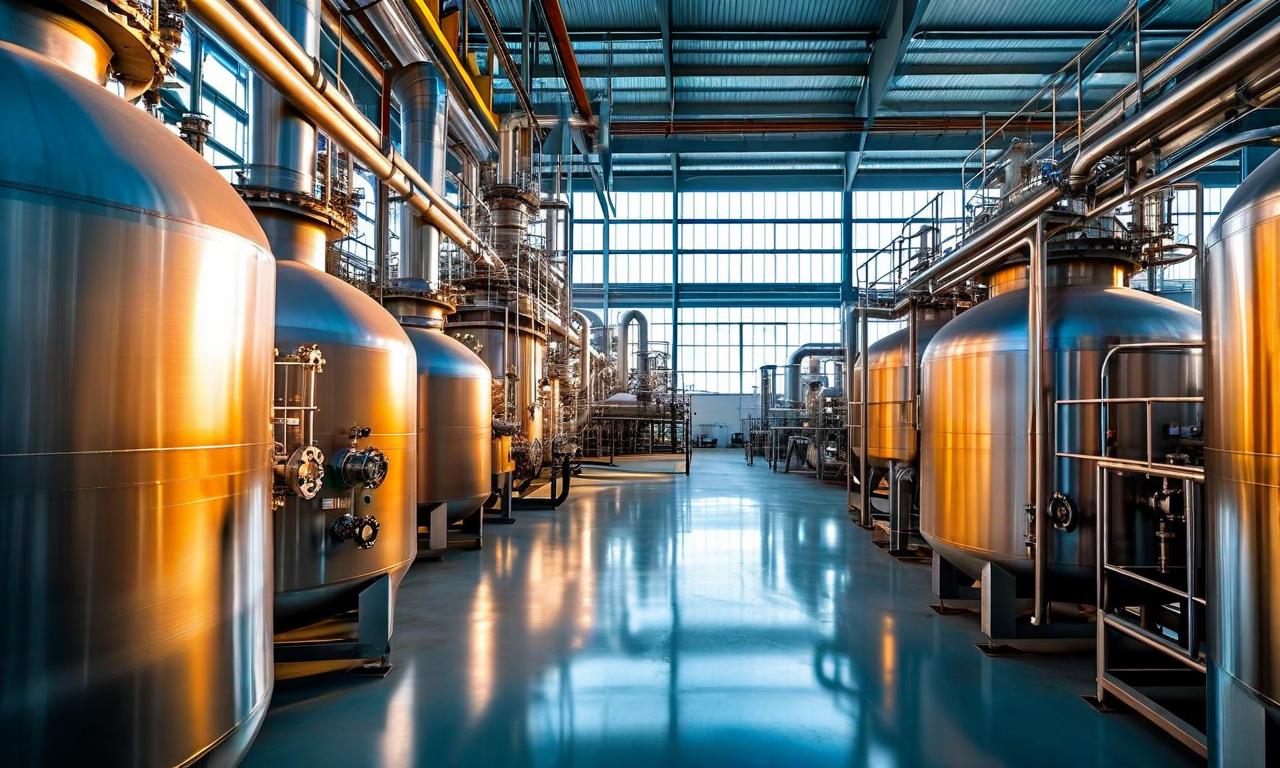
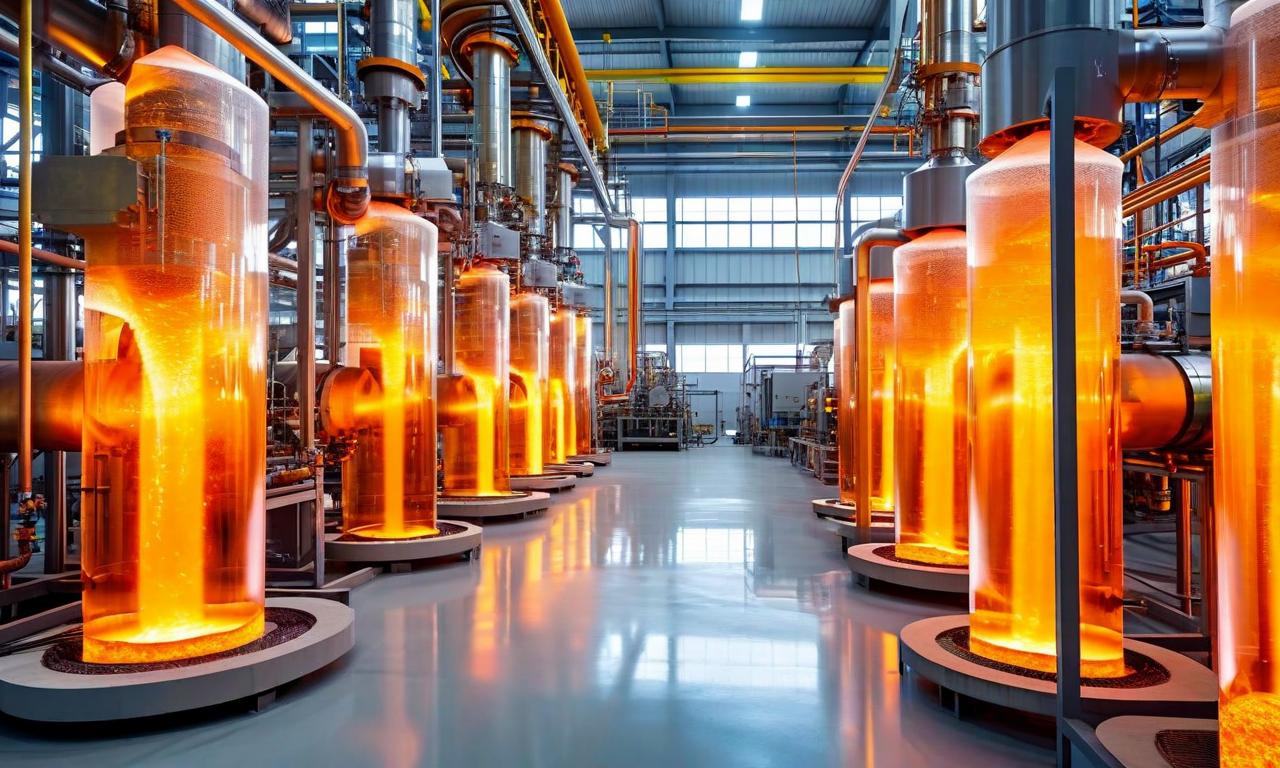
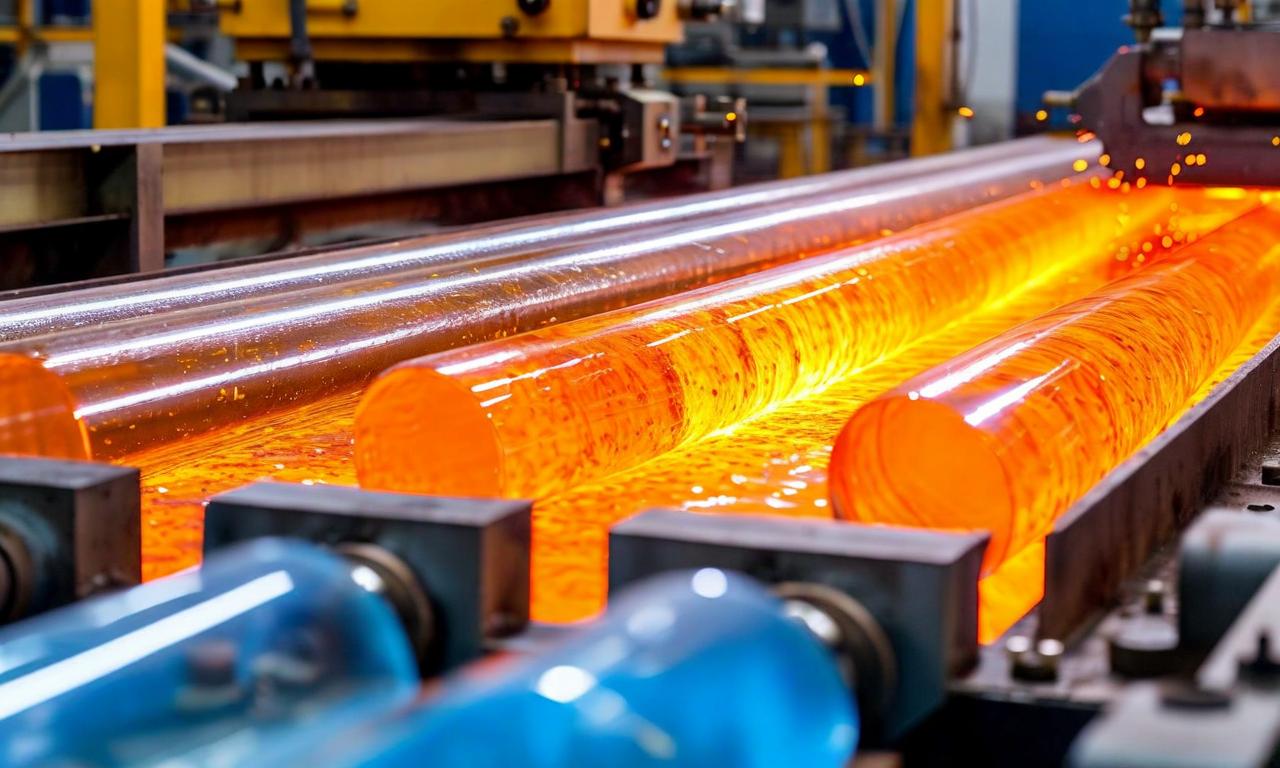
*this image is generated using AI for illustrative purposes only.
HLE Glascoat Limited announced its audited financial results for the quarter and year ended March 31, 2026. The company reported a resilient performance for the fiscal year, driven by robust revenue growth across its business verticals. The Board of Directors also recommended a final dividend for the financial year 2025-26. The company published the audited standalone and consolidated financial results in Business Standard and Jai Hind on May 20, 2026, pursuant to Regulation 47 of the SEBI (Listing Obligations and Disclosure Requirements) Regulations, 2015.
Consolidated Financial Performance
On a consolidated basis, revenue from operations for FY26 stood at ₹1,353.0 crore, representing a growth of 31.7% compared to ₹1,027.5 crore in the previous year. Profit After Tax (PAT) for the year was ₹56.6 crore, with a margin of 4.2%. EBITDA for the full year increased by 5.4% year-on-year to ₹148.5 crore, with an EBITDA margin of 11.0%. The financial performance includes the impact of exceptional items amounting to ₹6.7 crore, comprising costs related to business acquisitions and the statutory impact of new Labour Codes.
For the quarter ended March 31, 2026, consolidated revenue reached ₹391.7 crore, up 17.4% year-on-year. Q4 PAT was ₹20.1 crore, while EBITDA stood at ₹43.9 crore with a margin of 11.2%. The company noted that the results include an EBITDA loss of ₹15.3 crore and a PAT loss of ₹15.6 crore from the recently acquired Omeras business by HLE Surface Technologies GmbH.
The following table summarises the key consolidated financial metrics for the quarter and full year:
| Particulars (₹ Cr) | Q4 FY26 | Q4 FY25 | Y-o-Y | FY26 | FY25 | Y-o-Y |
|---|---|---|---|---|---|---|
| Revenue from Operations | 391.7 | 333.7 | 17.4% | 1,353.0 | 1,027.5 | 31.7% |
| EBITDA | 43.9 | 54.2 | -19.0% | 148.5 | 140.9 | 5.4% |
| EBITDA Margin | 11.2% | 16.3% | -510 bps | 11.0% | 13.7% | -270 bps |
| Profit After Tax | 20.1 | 31.6 | -36.3% | 56.6 | 61.8 | -8.4% |
| PAT Margin | 5.1% | 9.5% | -440 bps | 4.2% | 6.0% | -180 bps |
Segment-Wise Performance
The company reported broad-based growth across its segments. Filtration, Drying and Other Equipment revenue grew 50.9% to ₹474.3 crore in FY26, while Glass Lined Products revenue increased 16.2% to ₹676.4 crore. Heat Transfer Equipment revenue rose 64.6% to ₹200.3 crore.
| Segment | FY26 Revenue (₹ Cr) | FY25 Revenue (₹ Cr) | Y-o-Y |
|---|---|---|---|
| Filtration, Drying and Other Equipment | 474.3 | 314.2 | 50.9% |
| Glass Lined Products | 676.4 | 582.2 | 16.2% |
| Heat Transfer Equipment | 200.3 | 121.7 | 64.6% |
Operational Highlights and Corporate Developments
The company maintained a strong order book of ₹681.6 crore as of March 31, 2026, providing good visibility for future performance. During the quarter, HLE Glascoat incorporated a wholly owned subsidiary, HLE International S.a.r.l., in Luxembourg. The Board recommended a final dividend of ₹1.10 per equity share (55% on face value of ₹2 each) for the financial year 2025-26, subject to shareholder approval.
Historical Stock Returns for HLE Glascoat
| 1 Day | 5 Days | 1 Month | 6 Months | 1 Year | 5 Years |
|---|---|---|---|---|---|
| -3.84% | +1.59% | +1.63% | -12.31% | -3.42% | -44.26% |
How soon is the recently acquired Omeras business expected to turn profitable, and what synergies is HLE Glascoat targeting from this acquisition?
What is the strategic rationale behind incorporating HLE International S.a.r.l. in Luxembourg, and which geographies or markets will it target for international expansion?
Given the significant EBITDA margin compression of 270 basis points in FY26, what specific measures is management planning to restore margins to historical levels in FY27?
 15
15