

EP Biocomposites shares FY26 results in AGM presentation


- Revenue from operations rose to ₹1,363.98 lakh in FY26 from ₹1,200.62 lakh in FY25
- Profit after tax increased significantly to ₹145.83 lakh, up from ₹103.08 lakh
- EBITDA margin expanded to 17.43% from 15.69%, driven by operational efficiency
- Long-term borrowings reduced to ₹186.96 lakh from ₹245.15 lakh
- Aqua segment led revenue contribution at 49.45%, followed by FRP at 43.04%

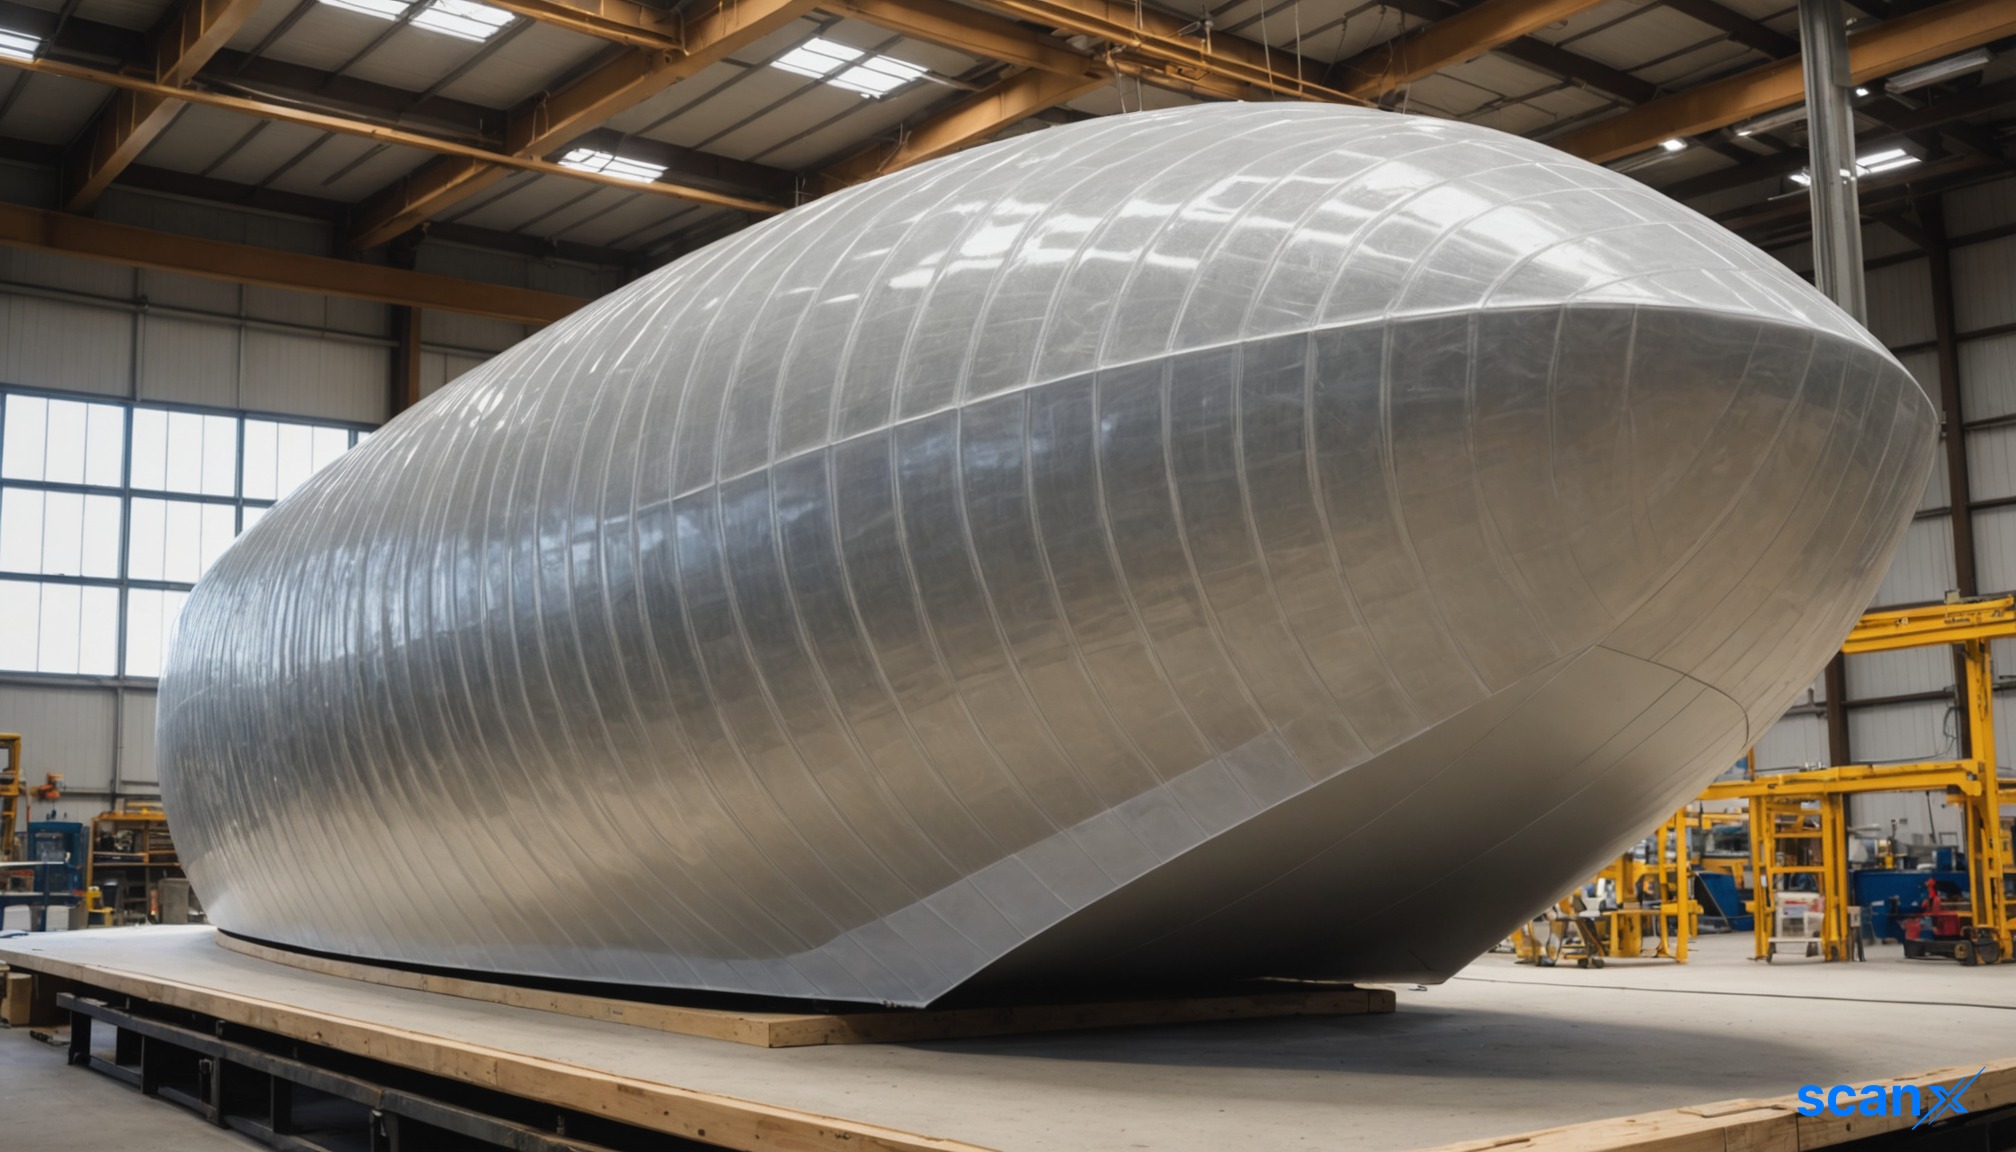

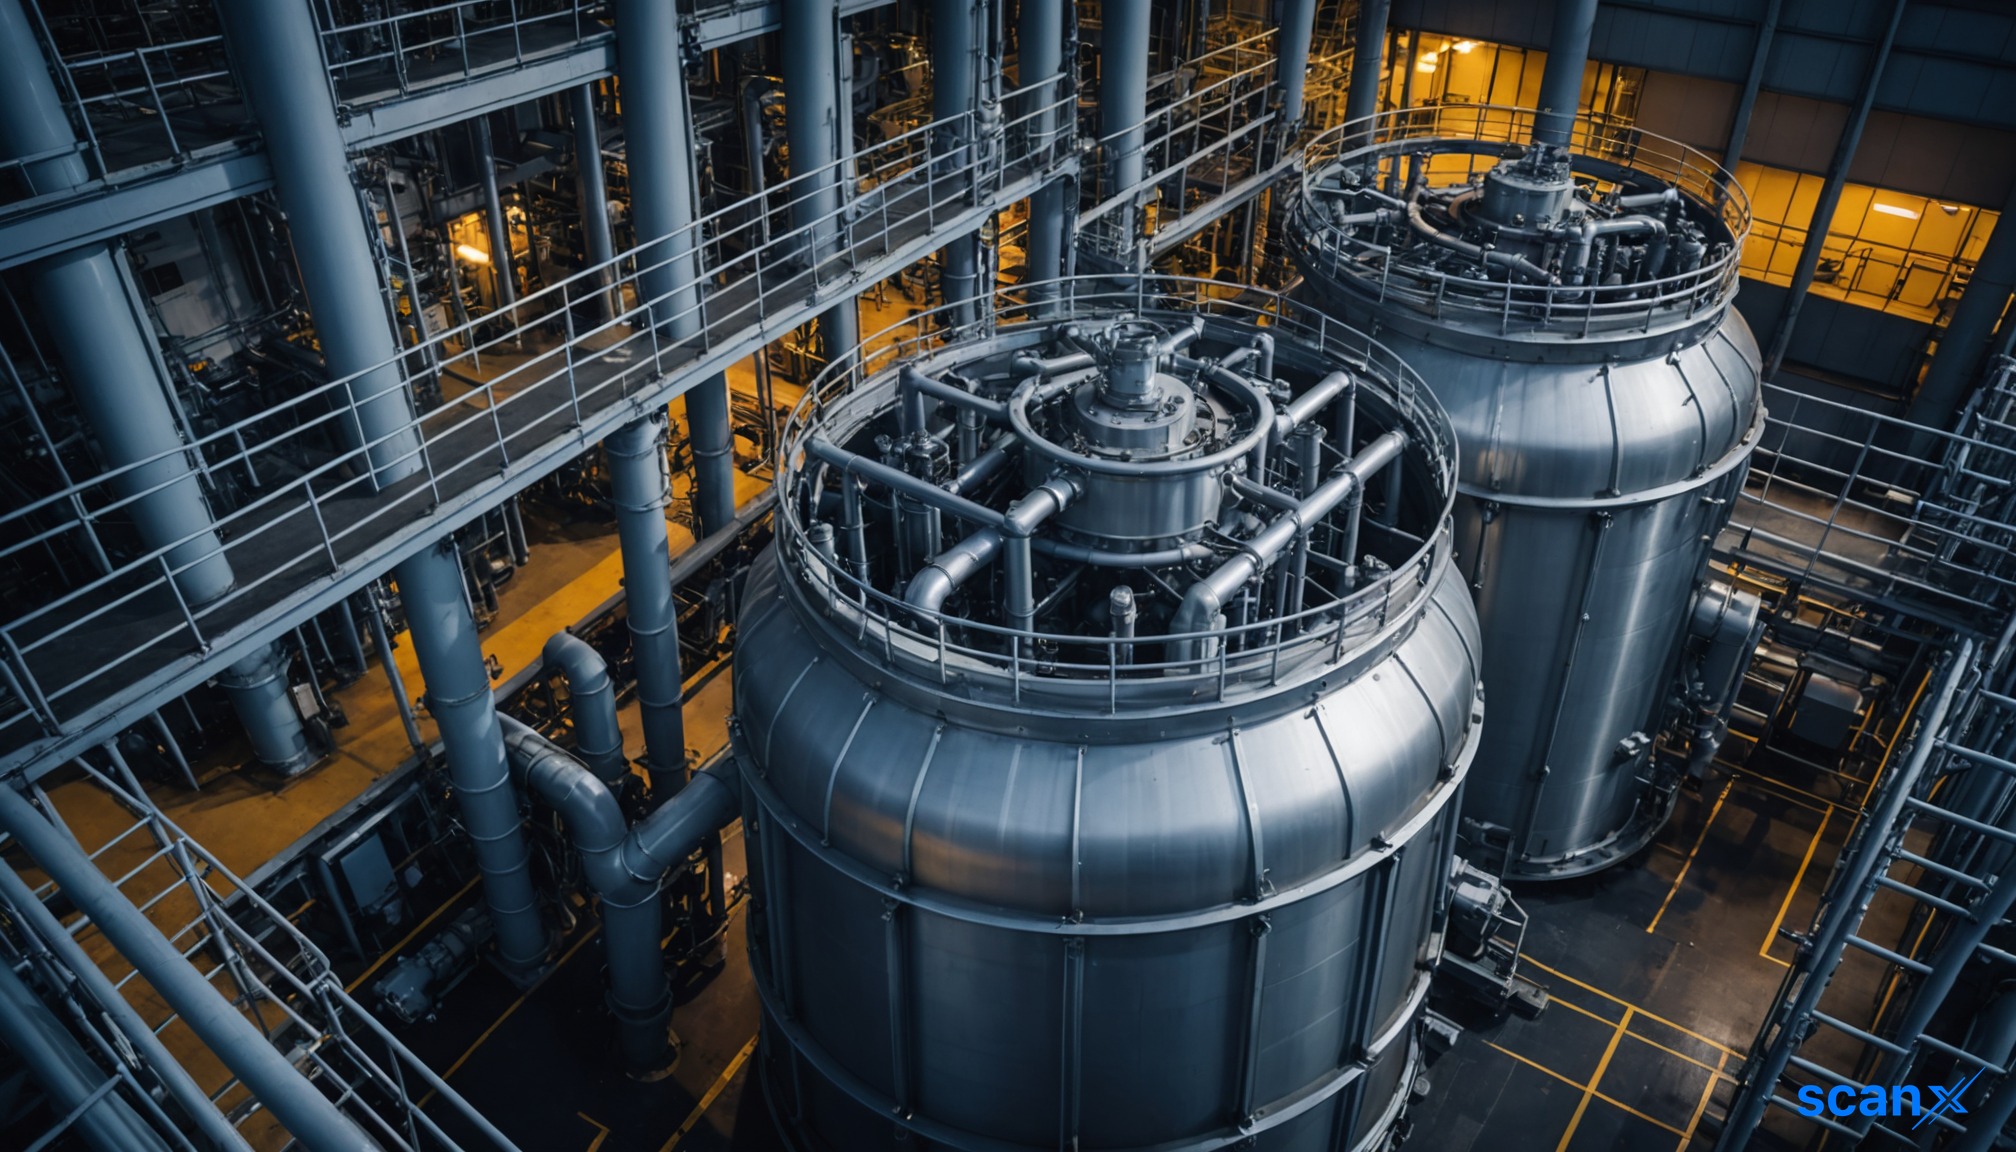
*this image is generated using AI for illustrative purposes only.
EP Biocomposites Limited has disclosed its investor presentation prepared for the upcoming annual general meeting. The filing was made pursuant to Regulation 30 of the SEBI (Listing Obligations and Disclosure Requirements) Regulations, 2015.
The Goa-based engineering and manufacturing company reported revenue from operations of ₹1,363.98 lakh for FY26, up from ₹1,200.62 lakh in FY25. This represents a year-on-year increase of approximately 13.6%.
Financial Performance
The company’s profitability metrics showed improvement alongside top-line growth. Key financial figures for the fiscal year ending March 31, 2026 are outlined below:
| Metric | FY26 | FY25 | FY24 |
|---|---|---|---|
| Revenue from Operations (₹ lakh) | 1,363.98 | 1,200.62 | 1,143.92 |
| EBITDA (₹ lakh) | 237.83 | 188.41 | 170.61 |
| EBITDA Margin (%) | 17.43 | 15.69 | 14.53 |
| Profit After Tax (₹ lakh) | 145.83 | 103.08 | 114.97 |
| PAT Margin (%) | 10.69 | 8.49 | 9.79 |
| Basic EPS (₹) | 8.67 | 6.13 | 6.84 |
Net profit for FY26 stood at ₹145.83 lakh, a significant rise from ₹103.08 lakh in the previous year. The profit after tax margin expanded to 10.69% from 8.49% in FY25.
What the Numbers Show
EBITDA grew by nearly 26% to ₹237.83 lakh in FY26, outpacing the 13.6% revenue growth. This divergence indicates operational leverage, as the EBITDA margin widened by 174 basis points to 17.43%. Finance costs remained relatively stable at ₹33.99 lakh compared to ₹35.46 lakh in FY25, suggesting controlled interest expenses despite higher operations.
Balance Sheet Position
As of March 31, 2026, total shareholders' funds increased to ₹1,205.30 lakh from ₹1,059.48 lakh in the prior year. Long-term borrowings decreased to ₹186.96 lakh from ₹245.15 lakh, indicating a reduction in long-term debt obligations. Cash and cash equivalents rose to ₹215.35 lakh from ₹161.67 lakh.
Trade receivables stood at ₹1,184.20 lakh, up from ₹1,085.68 lakh in FY25. Current liabilities totalled ₹471.19 lakh, an increase from ₹357.61 lakh in the previous fiscal year.
Business Operations
EP Biocomposites operates across three diversified verticals: Aqua (water treatment), Composites (FRP products), and Fire safety solutions. In FY26, the Aqua segment contributed the largest share of revenue at 49.45%, followed by FRP at 43.04% and Fire at 7.51%.
The company maintains a manufacturing facility in Goa with a capacity of 2.0 lakh sq. ft., operating at 70% utilization. It holds technology transfer rights from DRDO for bio-digester systems and serves government and institutional clients, which accounted for 60% of its revenue mix in FY26.
Historical Stock Returns for EP Biocomposites
| 1 Day | 5 Days | 1 Month | 6 Months | 1 Year | 5 Years |
|---|---|---|---|---|---|
| 0.0% | 0.0% | 0.0% | 0.0% | 0.0% | -40.56% |

How does EP Biocomposites plan to address the rising trade receivables, which have grown faster than revenue, to ensure healthy cash flow conversion?
What specific strategies is the company employing to increase its manufacturing capacity utilization from the current 70% to maximize operational leverage?
Given that government and institutional clients account for 60% of revenue, how exposed is the company to potential delays in public sector payments or policy shifts?
 20
20







 Access Market Heat-map & Insights
  Create, Save & Share your Screener
  Use 200+ Screening Filters





