

Eastern Treads Q1FY27 net loss widens 17% YoY to ₹16.4 lakh


Eastern Treads Ltd posted a Q1FY27 net loss of ₹16.37 lakh, up 17% YoY, as revenue fell 15.6% and finance costs rose 39.2%. The board appointed BVR and Associates as secretarial auditors and confirmed compliance with SEBI LODR regulations.


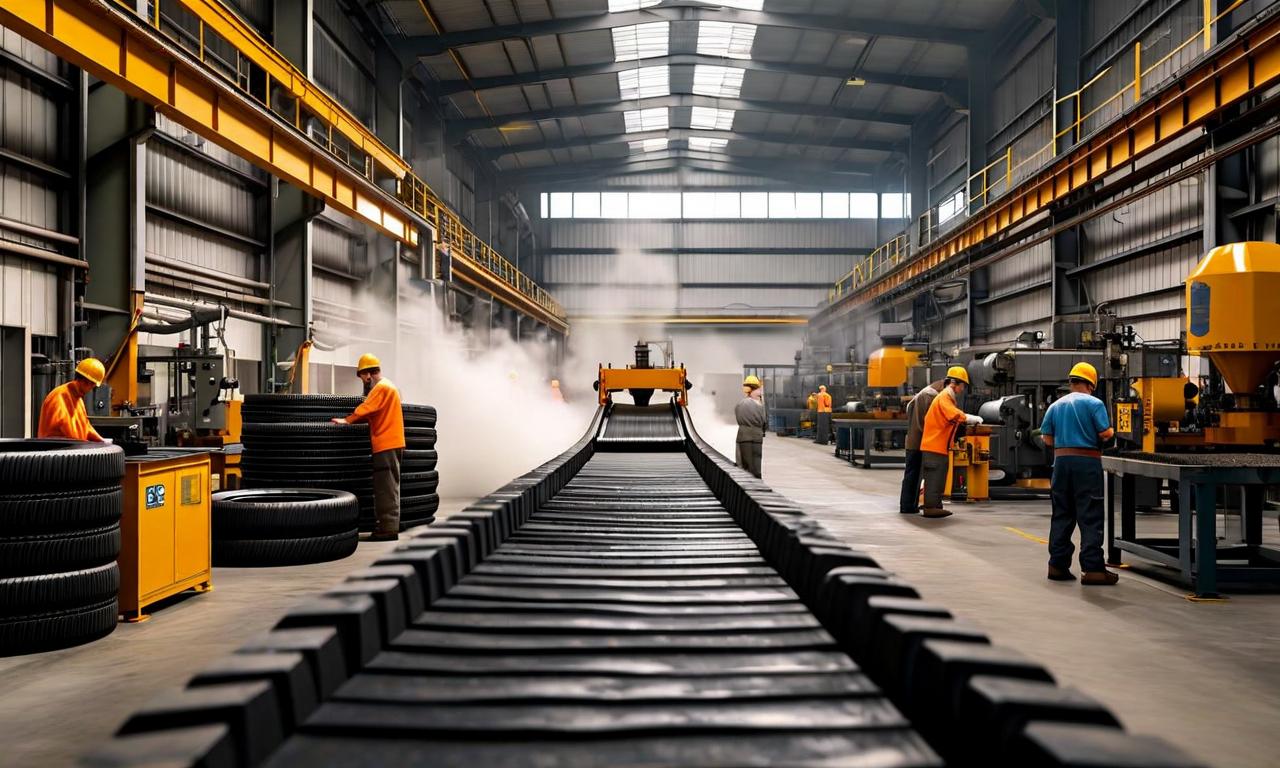
*this image is generated using AI for illustrative purposes only.
Eastern Treads reported a widened net loss in its first quarter of FY27, with standalone profit after tax slipping to a deficit of ₹16.37 lakh compared to a loss of ₹14 lakh in Q1FY26. The deterioration in profitability was driven by a contraction in top-line growth and rising interest expenses, despite a reduction in employee benefit costs.
Revenue from operations fell 15.6% year-on-year to ₹1,405.47 lakh, down from ₹1,664.91 lakh in the corresponding quarter of the previous fiscal. While the company managed to reduce employee benefits expense by 24.8% to ₹163.16 lakh, this operational saving was offset by a sharp rise in finance costs. Interest expenses jumped 39.2% to ₹81.87 lakh from ₹58.96 lakh a year ago, reflecting higher borrowing costs or increased debt servicing obligations.
Financial Performance Overview
The company’s total income stood at ₹1,416.10 lakh, while total expenses remained elevated at ₹1,432.47 lakh. Cost of materials consumed decreased marginally to ₹961.27 lakh from ₹1,092.77 lakh in Q1FY26, indicating some efficiency in raw material procurement or lower input prices. However, other expenses remained sticky at ₹210.06 lakh, only slightly lower than the ₹296.80 lakh recorded in the prior year period.
| Metric | Q1FY27 (₹ lakh) | Q1FY26 (₹ lakh) | Change |
|---|---|---|---|
| Revenue from Operations | 1,405.47 | 1,664.91 | -15.6% |
| Total Income | 1,416.10 | 1,677.72 | -15.6% |
| Finance Costs | 81.87 | 58.96 | +39.2% |
| Employee Benefits | 163.16 | 216.96 | -24.8% |
| Net Profit/(Loss) | (16.37) | (14.00) | -17.0% |
Unlike the previous quarter ended March 31, 2026, which included an exceptional gain of ₹205.03 lakh from the extinguishment of financial liabilities, Q1FY27 reported no such non-recurring items. Consequently, the loss before tax remained at ₹16.37 lakh, identical to the loss after tax due to no current or deferred tax charges being levied on the operating deficit.
What the Numbers Show
A notable divergence exists between the company’s revenue trajectory and its cost structure. While revenue contracted by nearly 16%, finance costs expanded by over 39%, suggesting that fixed financial obligations are becoming a heavier burden relative to shrinking earnings. This inverse relationship highlights increasing financial leverage pressure during a period of declining operational inflows. Additionally, the absence of deferred tax credits in the current quarter, unlike the ₹2.74 lakh credit seen in Q4FY26, indicates that the tax shield previously available may have been exhausted or adjusted based on current loss positions.
Corporate Governance Updates
In its board meeting held on August 14, 2026, Eastern Treads addressed compliance appointments. The Board approved the re-appointment of BVR and Associates, Company Secretaries LLP, as Secretarial Auditors for the financial year 2026-27. The firm, led by partners with over two decades of experience, will serve from April 1, 2026, to March 31, 2027. This appointment was made pursuant to Regulation 30 read with Schedule III - Para (A) (7) of the SEBI (Listing Obligations and Disclosure Requirements) Regulations, 2015.
The unaudited financial results were reviewed by G. Joseph & Associates, Chartered Accountants, who issued a clean review report stating that nothing came to their attention to suggest the statement did not comply with SEBI LODR regulations or Ind AS 34 standards. The management has assessed the company’s liquidity and going concern assumption, noting that despite eroded net worth—other equity stands at negative ₹1,820.01 lakh including accumulated losses of ₹3,123.7 lakh—they expect to recover asset carrying amounts and discharge liabilities based on business forecasts.
Historical Stock Returns for Eastern Treads
| 1 Day | 5 Days | 1 Month | 6 Months | 1 Year | 5 Years |
|---|---|---|---|---|---|
| +2.81% | +0.07% | -5.97% | +5.83% | -2.54% | -34.00% |

How does Eastern Treads plan to restructure its debt or refinance existing obligations to mitigate the 39.2% surge in finance costs amid declining revenues?
Given the negative other equity of ₹1,820.01 lakh, what specific operational milestones or asset recovery strategies is management targeting to validate its going concern assumption?
What are the primary drivers behind the 15.6% contraction in revenue, and does this reflect broader headwinds in the footwear industry or company-specific market share losses?
 16
16









 Create Custom Screeners
  Access 200+ Pre-built Filters
  Use 50+ Readymade Screener





