

Dredging Corporation of India turns profitable with 46.7% revenue surge in Q1FY27


DCIL returns to profitability with a net profit of ₹11.24 crore in Q1FY27, up from a loss of ₹23.33 crore. Revenue rose 46.7% to ₹355.43 crore, aided by a 68.5% drop in finance costs. EBITDA grew to ₹61.86 crore, though margins compressed slightly.

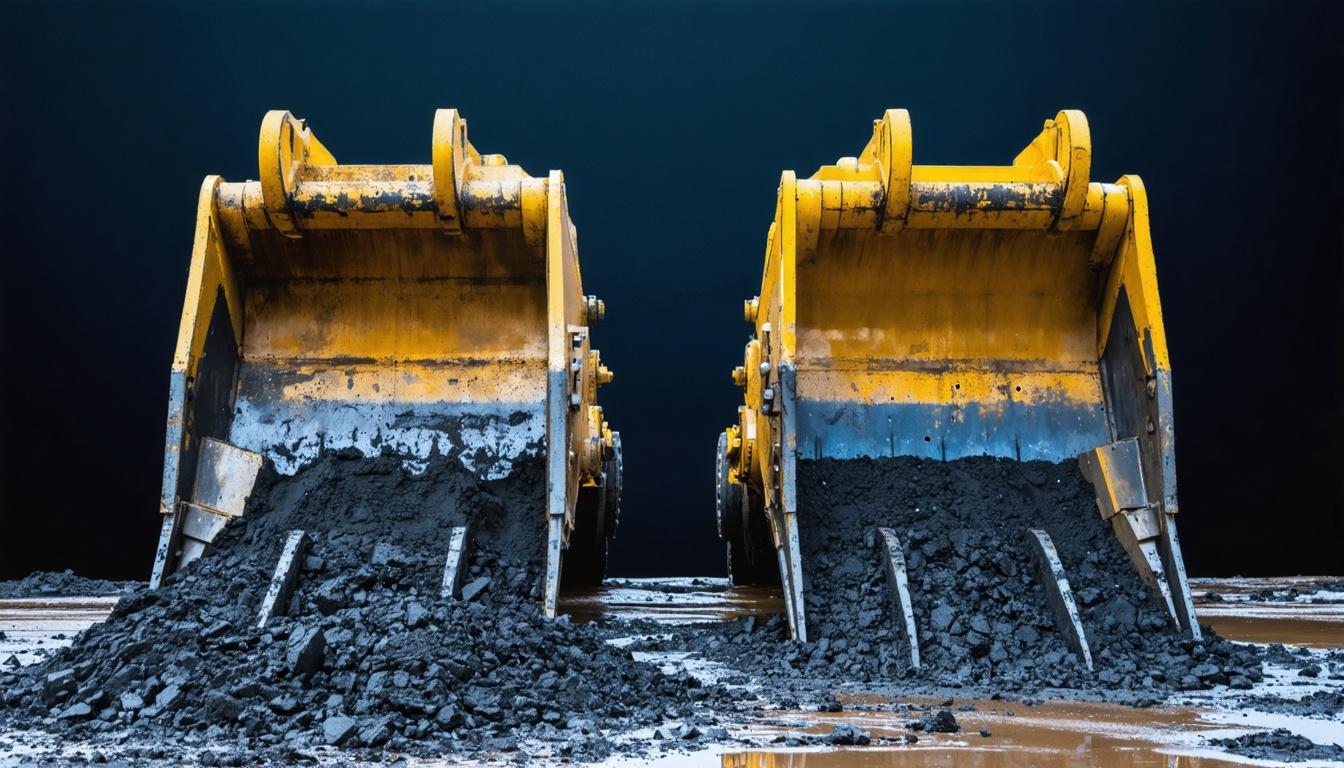

*this image is generated using AI for illustrative purposes only.
Dredging Corporation of India Limited (DCIL) reported a net profit of ₹11.24 crore for the quarter ended June 30, 2026, marking a significant turnaround from a net loss of ₹23.33 crore in the corresponding period of the previous fiscal year. The state-owned dredging firm saw its operational income rise by 46.73% to ₹355.43 crore, driven by improved project execution and efficient fleet deployment. This return to profitability is critical for investors monitoring the company's path toward sustained earnings after periods of volatility in the infrastructure sector.
The Board of Directors approved the unaudited standalone financial results on August 4, 2026, during a meeting held in Visakhapatnam. The results were reviewed by the Audit Committee and limited-reviewed by the statutory auditors, Grandhy & Co., who issued an unmodified opinion. The company filed the results with the Bombay Stock Exchange and the National Stock Exchange pursuant to Regulation 33 and Regulation 52 of the SEBI (Listing Obligations and Disclosure Requirements) Regulations, 2015.
Financial Performance Highlights
The primary driver of the improved bottom line was a sharp decline in finance costs, which fell to ₹9.88 crore from ₹31.39 crore in Q1FY26. This reduction significantly boosted the profit before tax, which stood at ₹11.50 crore compared to a loss of ₹23.19 crore in the prior year. EBITDA for the quarter increased to ₹61.86 crore against ₹46.90 crore in the year-ago period, though the EBITDA margin contracted to 17.41% from 19.37% year-on-year due to proportionally higher operating costs. The following table summarises the key financial metrics for the quarter:
| Particulars: | Q1FY27 (₹ in lakhs) | Q1FY26 (₹ in lakhs) | Change |
|---|---|---|---|
| Revenue from Operations | 35,543.41 | 24,224.46 | +46.7% |
| Total Income | 35,646.65 | 24,330.86 | +46.5% |
| Total Expenses | 34,497.11 | 26,650.30 | +29.5% |
| EBITDA | 6,186.00 | 4,690.00 | +31.77% |
| EBITDA Margin | 17.41% | 19.37% | -196 bps |
| Profit Before Tax | 1,149.54 | -2,319.44 | Turnaround |
| Net Profit After Tax | 1,123.54 | -2,333.26 | Turnaround |
| Earnings Per Share (₹) | 4.01 | -8.33 | N/A |
Finance costs dropped by 68.5% year-on-year, contributing heavily to the margin expansion. Employee benefit expenses increased moderately to ₹30.30 crore from ₹25.62 crore, while depreciation remained stable at ₹41.53 crore. Other income decreased slightly to ₹1.03 crore from ₹1.06 crore.
What the Numbers Show
The divergence between revenue growth (46.7%) and expense growth (29.5%) highlights an operating leverage effect, primarily fueled by fixed cost structures and reduced interest burdens. While subcontract expenses rose sharply to ₹125.56 crore from ₹40.84 crore, indicating significant project activity, the company managed to convert this into positive earnings. Capt. S. Divakar, Managing Director & CEO, attributed the performance to focused execution and optimum fleet utilisation. Shri Jasmeet Singh Bindra, IRTS, Chairman (Non-Executive), highlighted the strategic vision and operational resilience demonstrated by the team.
Balance Sheet Position
As of June 30, 2026, total assets stood at ₹3,099.91 crore, up from ₹3,065.71 crore at the end of March 2026. Trade receivables increased significantly to ₹442.78 crore from ₹235.86 crore, pointing to potential delays in collections or higher billing volumes near quarter-end. Cash and cash equivalents declined to ₹79.73 crore from ₹142.88 crore, likely due to working capital requirements and debt repayments. Long-term borrowings decreased to ₹707.39 crore from ₹815.15 crore, while short-term borrowings rose to ₹398.14 crore from ₹272.34 crore, indicating a shift in the debt maturity profile. The debt-equity ratio improved slightly to 0.89:1 from 0.88:1.
Historical Stock Returns for Dredging Corporation of India
| 1 Day | 5 Days | 1 Month | 6 Months | 1 Year | 5 Years |
|---|---|---|---|---|---|
| +0.97% | -9.29% | -16.05% | +8.99% | +44.45% | +156.10% |

How sustainable is the current reduction in finance costs, and what is DCIL's strategy for maintaining lower interest burdens in the coming quarters?
Given the sharp rise in trade receivables to ₹442.78 crore, what measures is the company implementing to accelerate collections and mitigate credit risk?
Will the significant increase in subcontract expenses signal a long-term shift in DCIL's operational model, and how will this impact future EBITDA margins?
 15
15




 Access Market Heat-map & Insights
  Create, Save & Share your Screener
  Use 200+ Screening Filters





