

De Nora India Q1 Results: Net profit surges 97% YoY to ₹638.96 lakh


De Nora India Limited delivered a robust Q1FY26 performance with net profit jumping 97% YoY to ₹638.96 lakh, reversing a loss in the preceding quarter. Revenue fell 12.6% to ₹3,872.26 lakh, pointing to margin-led growth. The Board approved the results on July 30, 2026, and filings were made with NSE and BSE.


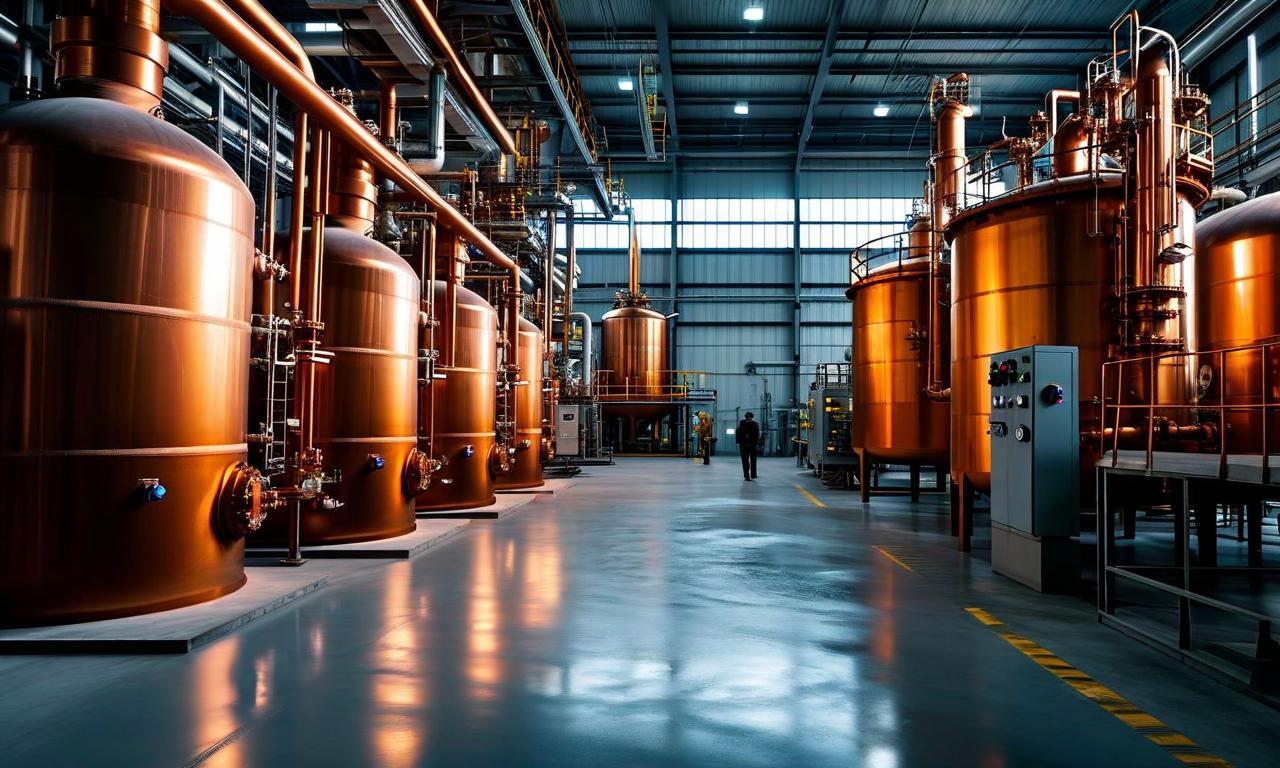
*this image is generated using AI for illustrative purposes only.
De Nora India Limited reported a significant turnaround in profitability for the first quarter of FY26, with net profit after tax surging 97% year-on-year to ₹638.96 lakh. This performance contrasts sharply with the previous quarter, where the company posted a net loss of ₹63.75 lakh for the quarter ended March 31, 2026. The strong quarterly result underscores an improvement in operational efficiency, even as total income from operations declined by 12.6% to ₹3,872.26 lakh compared to ₹4,432.63 lakh in Q1FY25.
The financial results were reviewed and approved by the Audit Committee and the Board of Directors in their meeting held on July 30, 2026. Pursuant to Regulation 30 and Regulation 47 of the SEBI (Listing Obligations and Disclosure Requirements) Regulations, 2015, the company published extracts of the unaudited financial results in Business Standard (English) and Tarun Bharat (Marathi) on July 31, 2026. The detailed quarterly results were filed with the stock exchanges under Regulation 33 of the same regulations.
Financial Performance Highlights
| Particulars | Q1FY26 (Unaudited) | Q4FY25 (Balancing) | Q1FY25 (Unaudited) | FY25 (Audited) |
|---|---|---|---|---|
| Total Income from Operations (₹ Lakh) | 3,872.26 | 2,383.67 | 4,432.63 | 12,897.77 |
| Net Profit Before Tax (₹ Lakh) | 859.89 | (92.85) | 434.21 | 1,199.97 |
| Net Profit After Tax (₹ Lakh) | 638.96 | (63.75) | 324.92 | 905.54 |
| Total Comprehensive Income (₹ Lakh) | 644.41 | (46.49) | 323.58 | 919.15 |
| Earnings Per Share (₹) | 12.04 | (1.20) | 6.12 | 17.06 |
Earnings per share (EPS) rose to ₹12.04 in Q1FY26, up from ₹6.12 in the corresponding quarter of the previous fiscal year. The company’s equity share capital remained unchanged at ₹530.86 lakh. Other equity as shown in the audited balance sheet was reported at ₹12,403.29 lakh for the full year ended March 31, 2026.
What the Numbers Show
The divergence between declining revenue and surging profits indicates a notable improvement in cost management or margin expansion during the quarter. While total income dropped by approximately ₹560 lakh year-on-year, the net profit before tax more than doubled from ₹434.21 lakh to ₹859.89 lakh. This suggests that fixed costs may have been better absorbed or that high-margin segments contributed disproportionately to the bottom line despite lower top-line growth. The reversal from a loss in Q4FY25 to a substantial profit in Q1FY26 highlights a volatile but improving operational trajectory.
Historical Stock Returns for De Nora
| 1 Day | 5 Days | 1 Month | 6 Months | 1 Year | 5 Years |
|---|---|---|---|---|---|
| -1.58% | -2.47% | -12.40% | -2.82% | -14.13% | +113.39% |

What specific operational strategies or cost-cutting measures drove the margin expansion despite a 12.6% decline in operating income?
Can De Nora India sustain this profitability trajectory in Q2FY26, or was the surge driven by one-off accounting adjustments?
How does the current revenue contraction compare to broader trends in the electrochemical equipment and water treatment sectors?
 16
16












 Create Custom Screeners
  Access 200+ Pre-built Filters
  Use 50+ Readymade Screener





