

Clean Max Enviro posts ₹55 crore Q1FY27 PAT, raises FY28 EBITDA guidance


Clean Max Enviro Energy Solutions delivered strong Q1FY27 results with a ₹55 crore PAT, fueled by doubled revenues and margin expansion. With 500 MW of new capacity added and a robust pipeline, the company raised its FY28 EBITDA guidance to ₹3,000 crore, highlighting significant growth in its Data and AI segment.


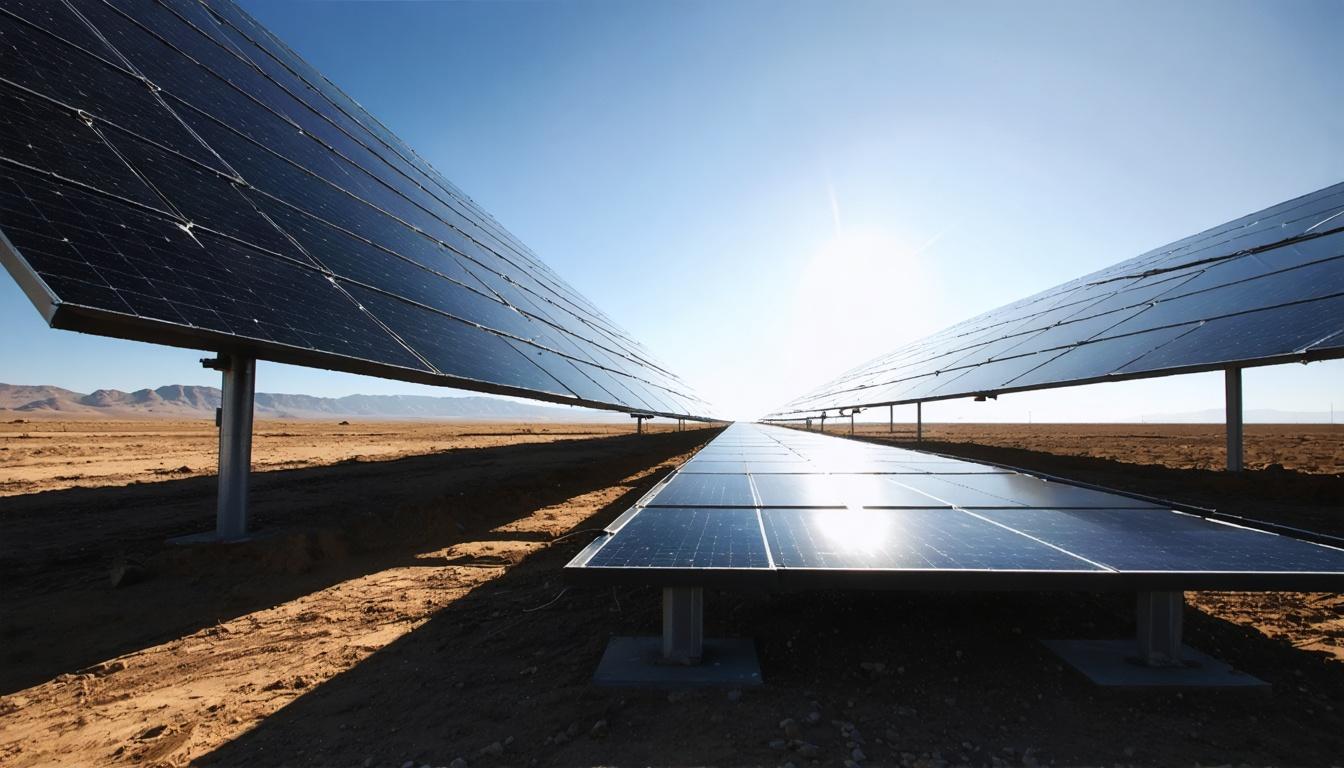
*this image is generated using AI for illustrative purposes only.
Clean Max Enviro Energy Solutions reported a profit after tax (PAT) of ₹55 crore for the quarter ended June 30, 2026, marking a significant turnaround driven by doubled revenues and expanded margins. The renewable energy provider added 500 megawatts of new operational capacity during the quarter and raised its EBITDA guidance for FY28 to a minimum of ₹3,000 crore, reflecting strong execution and demand in both data center and industrial segments.
The financial results were disclosed pursuant to Regulation 30 of the Securities and Exchange Board of India (SEBI) (Listing Obligations and Disclosure Requirements) Regulations, 2015. The earnings conference call transcript, signed by Company Secretary Ullash Parida on August 7, 2026, provides detailed insights into the company’s operational performance and strategic outlook.
Financial Performance Highlights
Revenue from operations surged 107% year-on-year to ₹832 crore. This growth was bifurcated across its two primary segments: Renewable Energy (RE) Power Sales grew 47% to ₹528 crore, while RE Services saw a six-fold increase to ₹300 crore due to higher project executions.
| Metric | Q1FY27 | Q1FY26 | Change |
|---|---|---|---|
| Revenue from Operations | ₹832 crore | ₹402 crore | +107% |
| EBITDA (Reported) | ₹462 crore | ₹274 crore | +68% |
| Profit After Tax (PAT) | ₹55 crore | Not Disclosed | Positive |
| Net Debt | ₹11,809 crore | ₹9,684 crore | +22% |
EBITDA margins improved across both segments. In RE Power Sales, margins rose from 76% to 84%, while RE Services margins increased from 9% to 11%. Founder and Managing Director Kuldeep Jain attributed the PAT growth to three key factors: revenue doubling, margin expansion, and reduced interest costs. The weighted average cost of debt fell by 100 basis points to 8.4% as of June 2026, down from 9.4% in April 2025.
Capacity Addition and Guidance
The company commissioned 400 MW in the RE Power Sales segment and 100 MW in the RE Services segment, totaling 500 MW in the quarter. As of June 30, 2026, Clean Max Enviro had 3.5 GW of operational capacity and 2.5 GW under construction, bringing the total portfolio to 6 GW contracted capacity.
Management provided a new forward-looking guidance, stating that it expects a minimum reported EBITDA of ₹3,000 crore in FY28. This represents nearly 2.4 times growth from the ₹1,290 crore EBITDA recorded in FY26. The guidance is underpinned by a plan to add at least 1.5 GW of new operational capacity in FY27, which would bring total operational sales capacity to a minimum of 4.6 GW by April 1, 2027.
Segmental Insights and Market Position
The Data and AI segment continues to be a major growth driver, accounting for 42% of contracted capacity. This segment has grown approximately 10 times between March 2024 and March 2026. Clean Max Enviro estimates holding a 35% market share in hyperscaler business in India, with deals announced with global entities such as Meta, Apple, Google, and Amazon in calendar 2026.
The conventional commercial and industrial (C&I) segment also demonstrated robust growth, with contracted volumes doubling over the last two years, translating to a 46% annual CAGR. Management highlighted that 80% of new volumes are secured from existing clients, maintaining a high-quality customer base where over 80% of clients are rated AA, AAA, or are multinational subsidiaries.
What the Numbers Show
The divergence between revenue growth (107%) and net debt increase (22%) indicates strong operating leverage and cash flow generation relative to capital expenditure. While net debt rose to ₹11,809 crore, 38% of this debt is linked to assets under construction, suggesting that future cash flows will support this leverage as these projects stabilize. The improvement in EBITDA margins despite rapid scale-up points to effective cost management and favorable tariff structures, with new contracted tariffs stabilizing at around ₹4 per unit.
Source: https://lodr-files.dhan.co/lodr-inputs/Company/INE647U01026/e67d5b08-c161-40a4-af3a-2a3da2994428.pdf
Historical Stock Returns for Clean Max Enviro Energy Solutions
| 1 Day | 5 Days | 1 Month | 6 Months | 1 Year | 5 Years |
|---|---|---|---|---|---|
| -1.88% | +1.78% | -5.45% | +55.93% | +52.51% | +52.51% |

How will Clean Max Enviro manage its rising net debt of ₹11,809 crore as it scales operational capacity to 4.6 GW, and what is the strategy for debt servicing amidst potential interest rate fluctuations?
Given the 35% market share in the hyperscaler segment, what specific strategies does Clean Max have to defend against new entrants or aggressive pricing from competitors in the data center renewable energy space?
With 38% of debt linked to assets under construction, what are the key execution risks or regulatory hurdles that could delay the commissioning of the planned 1.5 GW capacity addition in FY27?
 15
15













 Create Custom Screeners
  Access 200+ Pre-built Filters
  Use 50+ Readymade Screener





