

Artson wins Rs 7.17 crore work order from L&T MHI for NTPC Nabinagar


- Artson wins a confirmed Rs 7.17 crore work order from L&T MHI for vessel supply at NTPC Nabinagar.
- Total disclosed order book rises to Rs 27.17 crore, covering approximately 22.68 quarters of backlog.
- Order inflow accelerated from Rs 5.40 crore in Q1FY27 to Rs 14.63 crore in Q2FY27.
- Trailing twelve-month revenue and net profit are both Rs 0.00 crore, indicating delayed revenue recognition.
- Execution capacity and working capital management will be key as the company converts backlog into sales.

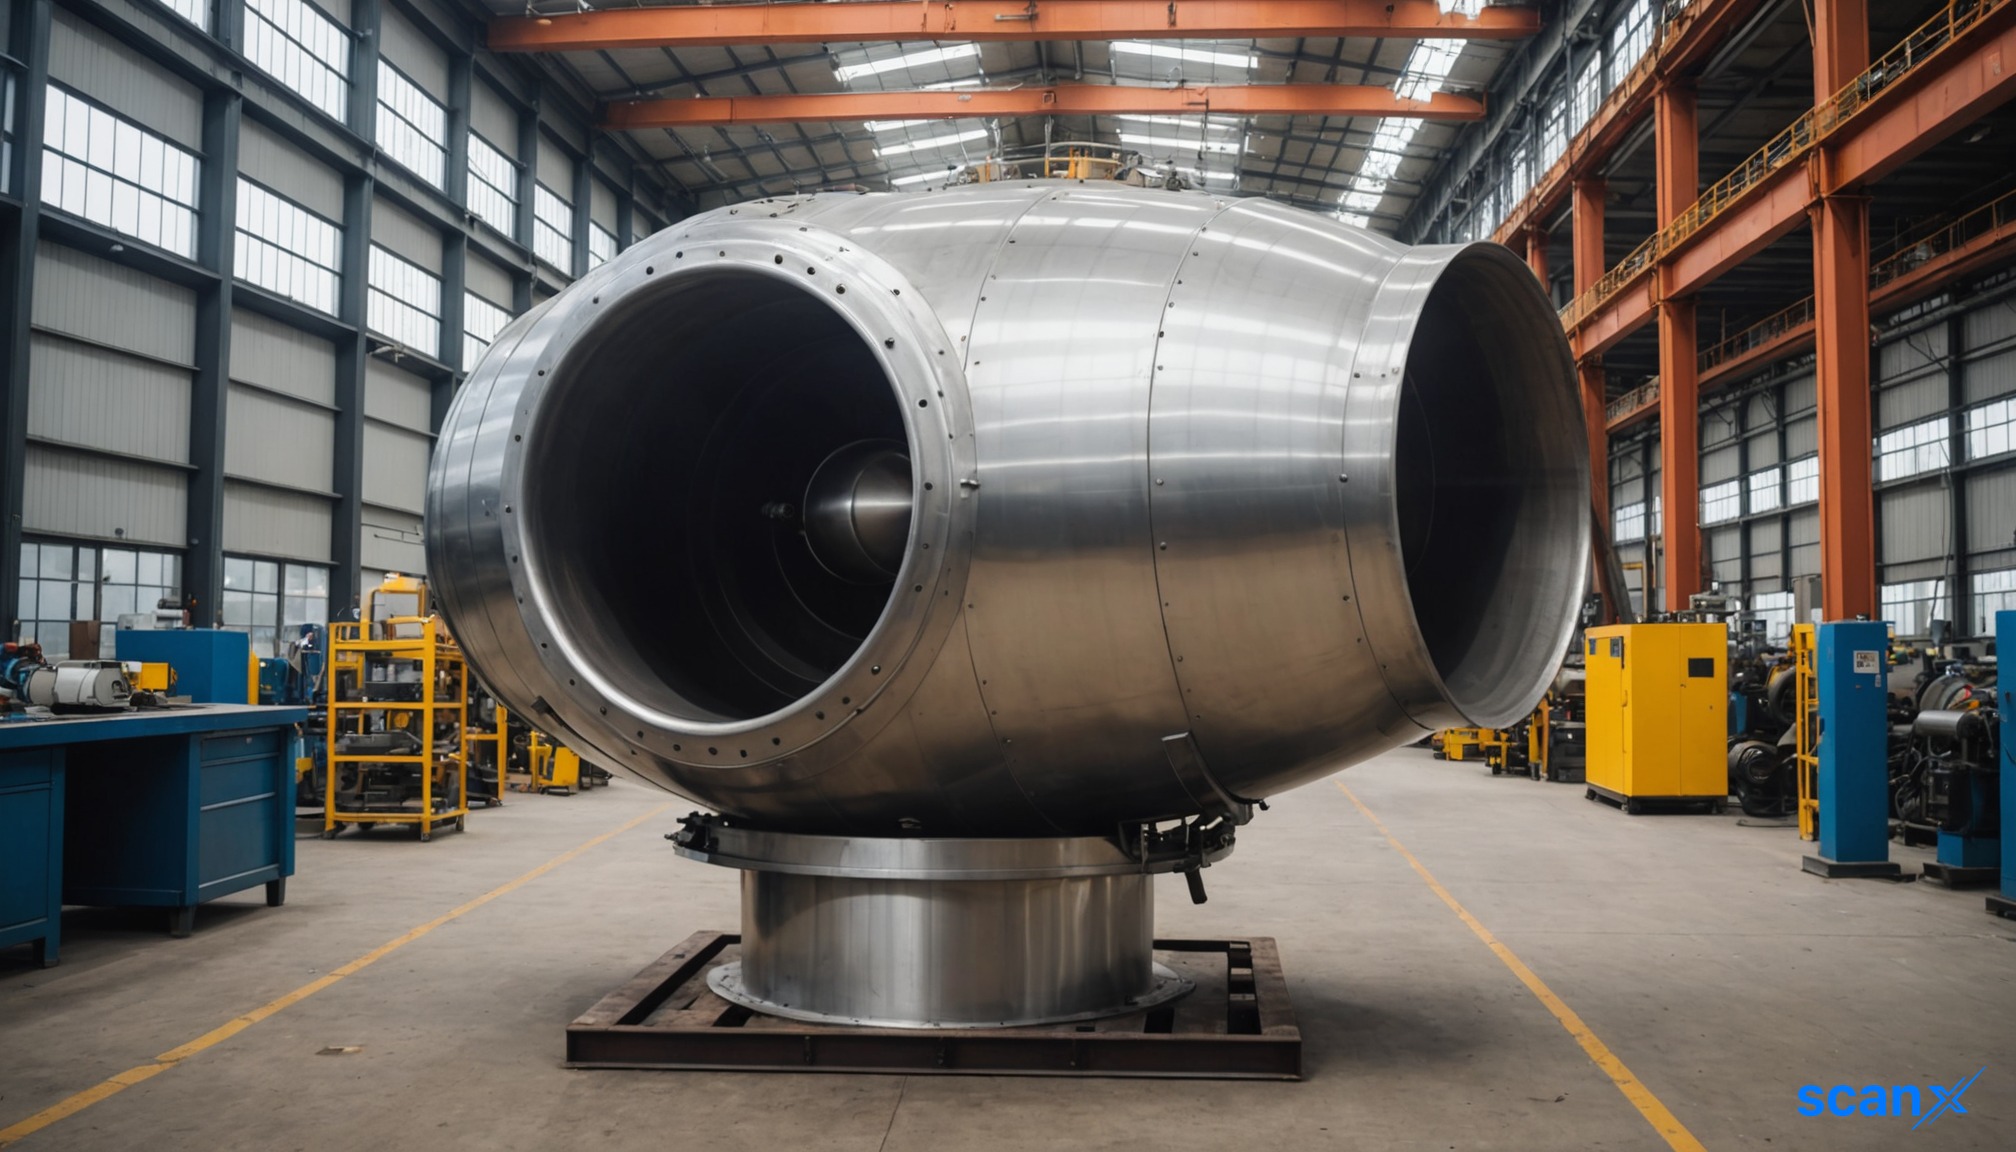

*this image is generated using AI for illustrative purposes only.
WHAT HAPPENED
Artson has won a confirmed work order worth Rs 7.17 crore from L&T MHI Power Boilers Private Limited. The contract covers the supply of 24 vessels for three boilers at the NTPC Nabinagar plant.
ORDER IN FINANCIAL CONTEXT
The Rs 7.17 crore order represents a significant addition to the company's pipeline. Given that the average quarterly revenue is Rs 0.00 crore based on trailing twelve-month data, the order value is technically infinite times the quarterly run rate. The total disclosed order book stands at Rs 27.17 crore (sum of the 3 orders disclosed across the last 3 fiscal quarters shown in the table below), which represents approximately 22.68 quarters of backlog coverage. This high coverage suggests that execution capacity and working capital deployment will be the primary drivers of future revenue recognition rather than order acquisition.
COMPANY ORDER TRACK RECORD
Order inflow velocity has accelerated recently, with Q2FY27 recording Rs 14.63 crore against Rs 5.40 crore in Q1FY27. The current order size of Rs 7.17 crore is consistent with the company's typical per-order range, sitting between the recent wins of Rs 5.40 crore and Rs 14.63 crore.
| Quarter | Total Order Inflow (Rs Cr) | Key Awarding Entities |
|---|---|---|
| Q2FY27 (Jul-Sep 2026) | 14.63 | TKIL Industries Private Limited, Pune |
| Q1FY27 (Apr-Jun 2026) | 5.40 | Deepak Chem Tech Limited |
EXECUTION AND REVENUE QUALITY
The most critical observation is that trailing twelve-month consolidated revenue, net profit, and operating profit margin are all Rs 0.00 crore and 0.0% respectively. This indicates that existing backlogs have not yet translated into recognized revenue or cash flows in the latest reporting period. Investors should monitor closely for any quarter where revenue recognition begins to pick up, as the current zero-revenue status masks the underlying operational activity suggested by the order book.
| Quarter | Revenue (Rs Cr) | Net Profit (Rs Cr) | OPM (%) |
|---|---|---|---|
| TTM | 0.00 | 0.00 | 0.0% |
WORKING CAPITAL AND EXECUTION CAPACITY
With no operating cash flow or free cash flow data available from the provided inputs, it is difficult to assess immediate liquidity constraints. However, the balance sheet shows a Total Liabilities/Equity ratio that is not explicitly provided in the input fields, preventing a direct leverage assessment. The absence of negative cash flow signals is neutral, but the lack of positive cash flow generation alongside a growing order book warrants monitoring of working capital requirements for vessel fabrication and supply.
WHAT TO WATCH
- Execution rate: Quarterly revenue run-rate vs total backlog; monitor acceleration from the current zero-revenue baseline.
- OPM trajectory: Margin quality on new orders vs historical average; currently obscured by zero reported profits.
- Client concentration: What % of disclosed order book comes from top 1-2 clients; note if any single client accounts for more than 40% of the total disclosed order book.
- Delivery milestones: Unit # 4 delivery by Feb 2027, Unit # 5 by May 2027, and Unit # 6 by Aug 2027.
KEY OBSERVATIONS
- Backlog signal: Book-to-bill is effectively infinite given Rs 0.00 crore TTM revenue. At this level, execution capacity becomes the binding constraint.
- Valuation check (as of 05 Sep 2026): P/E of -51.7x against ROCE of 56.67%. At the time of this article, valuation was pricing in execution improvement not yet visible in return ratios. (P/E is price-derived and will change; ROCE is from audited financials)
- Revenue visibility: Trailing twelve-month revenue is Rs 0.00 crore. This suggests a potential lag in revenue recognition or a project-based cycle where billing has not yet commenced for the disclosed orders.
Historical Stock Returns for Artson
| 1 Day | 5 Days | 1 Month | 6 Months | 1 Year | 5 Years |
|---|---|---|---|---|---|
| +2.38% | -7.69% | -8.87% | +3.73% | 0.0% | +122.38% |








 Access Market Heat-map & Insights
  Create, Save & Share your Screener
  Use 200+ Screening Filters





