

All Time Plastics Q1FY27 results: Revenue up 10.5% QoQ to ₹161 crore


All Time Plastics reported Q1FY27 revenue of ₹161 crore, up 10.5% sequentially, driven by a 25% increase in polymer processing volumes. Gross margins compressed to 39.5% due to raw material inflation, while PAT rose 28.8% to ₹12 crore. The company is expanding capacity and launching a bamboo manufacturing unit in Q4FY27.


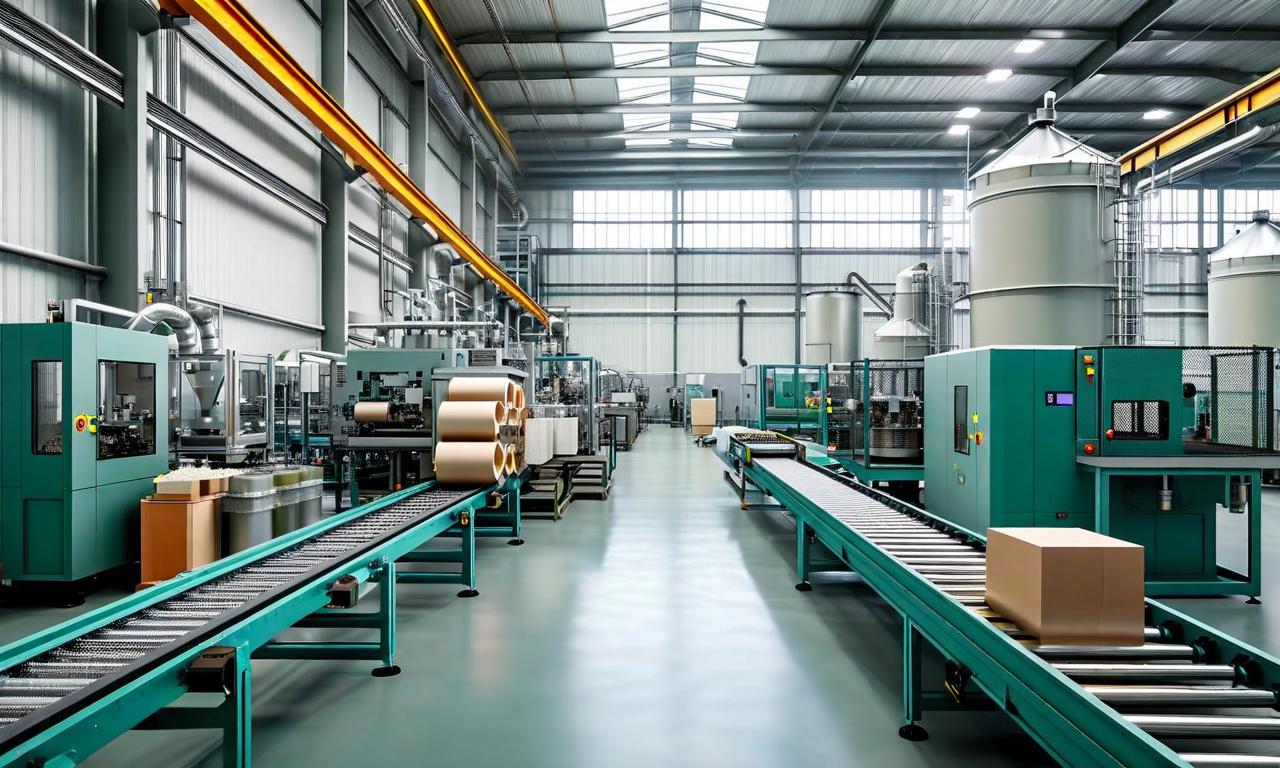
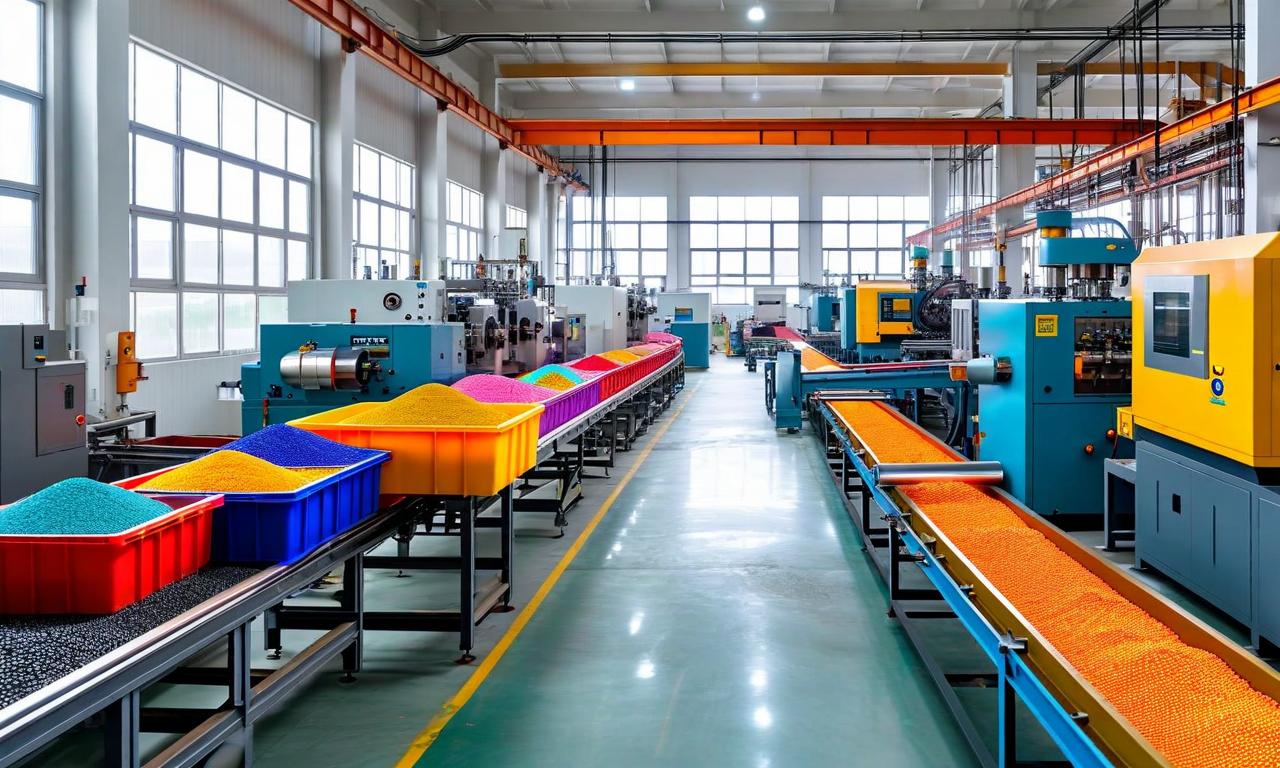
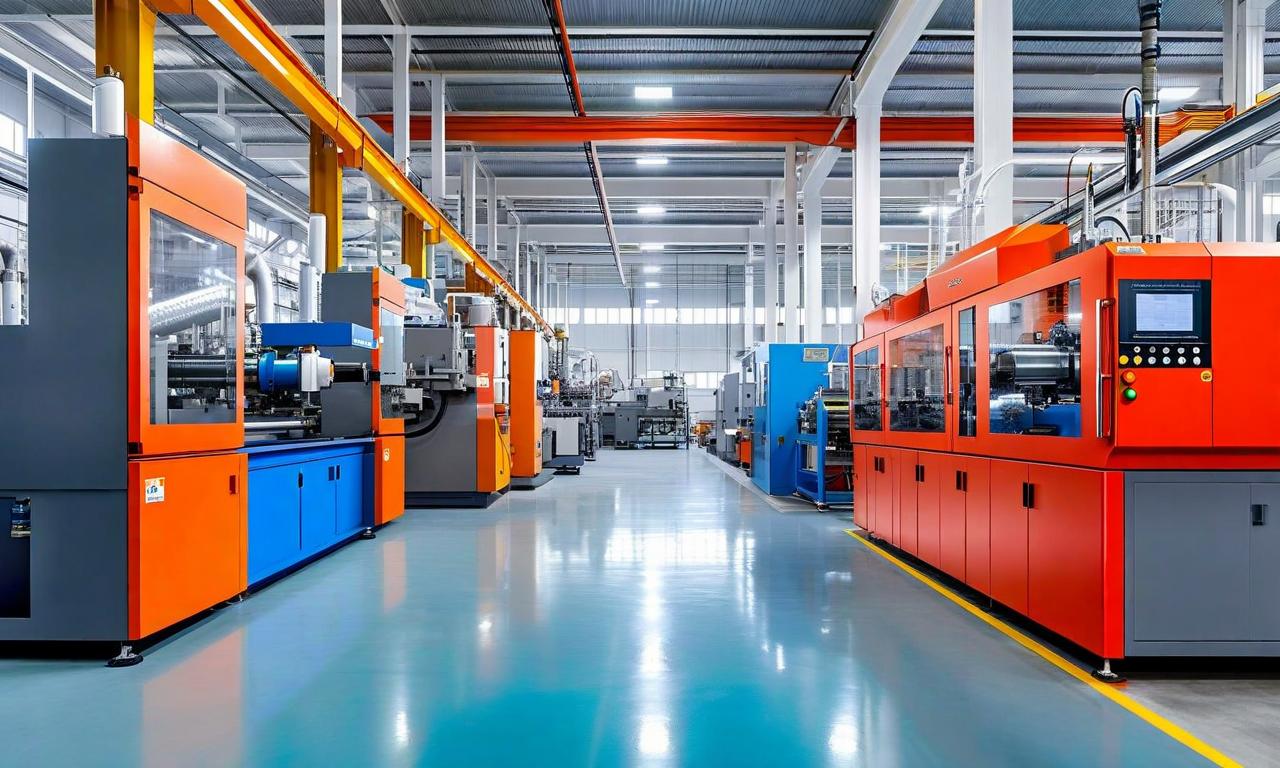
*this image is generated using AI for illustrative purposes only.
All Time Plastics Limited has released the transcript of its Q1FY27 earnings conference call, held on August 6, 2026. The disclosure provides investors with management’s detailed commentary on the quarter’s financial performance, operational metrics, and strategic outlook amid ongoing geopolitical volatility in West Asia.
The filing was submitted to BSE Limited and National Stock Exchange India Ltd on August 13, 2026, in compliance with Regulation 30 of the SEBI LODR Regulations, 2015. The document was signed by Antony Alapat, Company Secretary.
Financial Performance
Revenue from operations for Q1FY27 stood at ₹161 crore, reflecting a 10.5% sequential increase from ₹146 crore in Q4FY26 and a 2% year-on-year rise from ₹158 crore in Q1FY26. Gross profit was reported at ₹64 crore, with gross margins compressing by 240 basis points to 39.5% from 41.9% in the preceding quarter. This compression was attributed to a 40% to 50% spike in polymer input costs, partially offset by price renegotiations with customers.
EBITDA for the quarter was ₹23 crore (margin: 14.3%), up 6.8% sequentially from ₹22 crore but down 20% year-on-year from ₹29 crore. Net profit (PAT) rose 28.8% sequentially to ₹12 crore (margin: 7.5%), compared to ₹9 crore in Q4FY26.
| Metric | Q1FY27 | Q4FY26 | QoQ Change | Q1FY26 | YoY Change |
|---|---|---|---|---|---|
| Revenue | ₹161 crore | ₹146 crore | +10.5% | ₹158 crore | +2% |
| Gross Margin | 39.5% | 41.9% | -240 bps | 39.3% | +20 bps |
| EBITDA | ₹23 crore | ₹22 crore | +6.8% | ₹29 crore | -20% |
| PAT | ₹12 crore | ₹9 crore | +28.8% | ₹13 crore | -5.5% |
Operational Highlights
The volume of polymers processed increased by 25% sequentially to 6,323 metric tons, up from 5,056 metric tons in Q4FY26. Capacity utilization improved to 64.9% from 51.9%, measured against an installed capacity of approximately 41,000 metric tons. Sales volume rose to 6,090 tons from 5,831 tons in the previous quarter.
Working capital cycle extended modestly to 60 days from 57 days at the end of FY26. Inventory days increased to 44 from 42 due to higher raw material cover, while receivable days moved to 50 from 48. Payable days remained stable at 34. The debt-to-equity ratio stood at a robust 0.14 times.
Strategic Updates
Management highlighted several key strategic developments:
- Capacity Expansion: Orders placed for 14 new injection moulding machines to add ~1,500 tons of incremental capacity, expected in Q4FY27. Total capacity is projected to reach 52,000 tons over time.
- Bamboo Initiative: A new 75,000 sq ft facility in Guwahati is under pre-installation. Machinery is expected to arrive by mid-August, with commercial operations commencing in Q4FY27. Phase 1 capacity is 3,000 cubic meters per annum.
- Geographic Mix: US revenue contribution rose to 19% in Q1FY27 from 12% in FY26. Europe remains the largest market at 52%, followed by India at 16% and the UK at 11%.
- Domestic Growth: The company targets 30% to 35% growth in domestic business, supported by brand scaling and OEM partnerships.
What the Numbers Show
The divergence between the 25% sequential rise in processed volumes and only a 10.5% revenue increase highlights the significant impact of raw material cost inflation. While volumes surged, the 40-50% spike in polymer prices compressed gross margins by 240 basis points, indicating that full cost pass-throughs are still lagging. However, the 28.8% sequential jump in PAT suggests that fixed cost absorption from higher utilization is beginning to offset margin pressure, particularly as the company navigates supply chain disruptions without losing sales.
Source: https://lodr-files.dhan.co/lodr-inputs/Company/INE0GV601021/81e29aae-834d-4541-93d4-0a752a22618c.pdf
Historical Stock Returns for All Time Plastics
| 1 Day | 5 Days | 1 Month | 6 Months | 1 Year | 5 Years |
|---|---|---|---|---|---|
| +2.35% | -4.51% | -15.09% | -17.84% | -32.79% | -36.62% |

How will the 40-50% spike in polymer input costs impact All Time Plastics' ability to fully pass on price increases to customers in Q2FY27?
What specific strategies is management employing to mitigate the margin compression risk associated with the lagging cost pass-throughs?
How might the ongoing geopolitical volatility in West Asia affect the company's supply chain stability and raw material sourcing for the remainder of FY27?
 20
20











 Create Custom Screeners
  Access 200+ Pre-built Filters
  Use 50+ Readymade Screener





