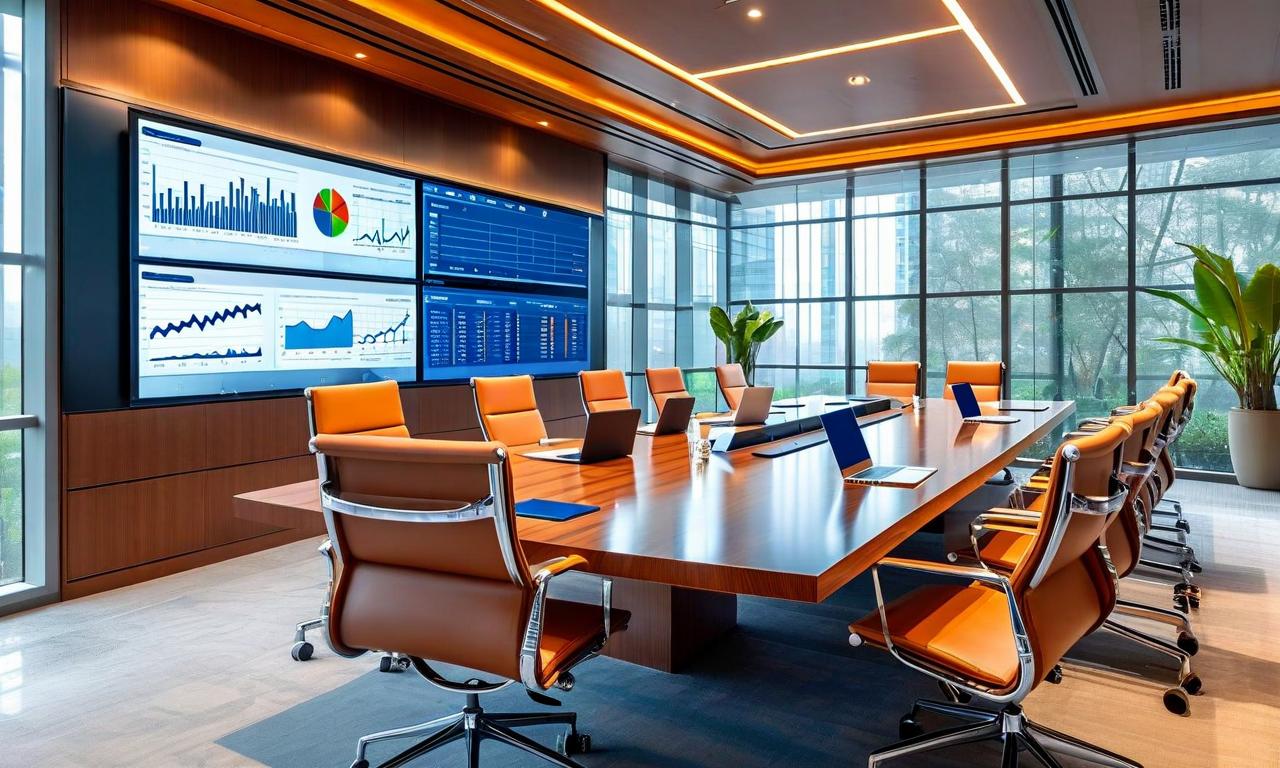
Aditya Vision Limited's Board of Directors, at its meeting held on Friday, May 08, 2026, considered and approved the Standalone Audited Financial Results for the quarter and year ended March 31, 2026. The board also recommended a final dividend of 125%, amounting to ₹1.25 per share of ₹1 each, subject to shareholder approval at the ensuing Annual General Meeting. The meeting commenced at 02:30 PM and concluded at 02:57 PM, with the results carrying an unmodified audit opinion from statutory auditors Nirmal & Associates, Chartered Accountants. The results were signed by Yashovardhan Sinha, Managing Director (DIN-01636599), and Vikash Kumar, Chief Financial Officer. Alongside the results, the company submitted an Investor Presentation for the quarter and year ended March 31, 2026, authenticated by Akanksha Arya, Company Secretary. Pursuant to Regulation 47 of the SEBI (Listing Obligations and Disclosure Requirements) Regulations, 2015, the company published a newspaper advertisement pertaining to the audited financial results in Business Standard (English) and Aj (Hindi) on May 09, 2026.
In his message accompanying the investor presentation, Chairman & Managing Director Yashovardhan Sinha noted that FY26 was an unusual year marked by prolonged and unseasonal rainfall that engulfed the entire H1. Despite this, Aditya Vision delivered a strong performance, with revenue growing 18% YoY and PAT rising 11% YoY, reflecting the resilience of the business model and the enduring trust of customers.
Financial Performance: Quarter and Full Year
The company delivered strong performance for the full year, with revenue from operations rising to ₹2,671.62 crores compared to ₹2,259.77 crores in the previous year — an 18% YoY growth. Net profit for the full year stood at ₹116.92 crores, up from ₹105.49 crores in the prior year, reflecting an 11% YoY increase. On a quarterly basis, Q4 net profit grew to ₹21.73 crores from ₹15.98 crores in Q4 of the previous year, while Q4 revenue from operations rose to ₹625.03 crores from ₹486.69 crores YoY. The following table presents the key financial metrics:
| Particulars: |
Q4 FY26 |
Q3 FY26 |
Q4 FY25 |
FY26 |
FY25 |
| Revenue from Operations (₹ Cr): |
625.03 |
648.86 |
486.69 |
2,671.62 |
2,259.77 |
| Other Income (₹ Cr): |
2.15 |
3.83 |
2.44 |
9.87 |
7.78 |
| Total Revenue (₹ Cr): |
627.18 |
652.69 |
489.13 |
2,681.49 |
2,267.55 |
| Total Expenses (₹ Cr): |
596.51 |
615.01 |
465.01 |
2,523.07 |
2,124.43 |
| Profit Before Tax (₹ Cr): |
30.67 |
36.15 |
24.12 |
156.89 |
143.12 |
| Net Profit (₹ Cr): |
21.73 |
27.31 |
15.98 |
116.92 |
105.49 |
| Basic EPS (₹): |
1.69 |
2.12 |
1.24 |
9.07 |
8.21 |
| Diluted EPS (₹): |
1.68 |
2.11 |
1.23 |
9.05 |
8.16 |
The investor presentation highlighted key profitability metrics, with EBITDA growing to ₹228 crores in FY26 from ₹204 crores in FY25, reflecting an EBITDA margin of 8.5%. Q4 FY26 EBITDA stood at ₹50.50 crores versus ₹42.30 crores in Q4 FY25, with Q4 FY26 EBITDA margin at 8.1% compared to 8.7% in Q4 FY25. PAT margin for FY26 was 4.4%, compared to 4.7% in FY25. Approximately 53% of sales were financed in FY26.
Expense Breakdown
On the expenditure side, purchases of stock-in-trade for the full year amounted to ₹2,398.33 crores against ₹2,169.73 crores in the previous year. Employee benefits expense rose to ₹81.94 crores from ₹71.02 crores. Finance costs for the year stood at ₹38.89 crores, while depreciation and amortisation expense was ₹40.46 crores. Operating and other expenses for the full year were ₹105.69 crores compared to ₹79.98 crores in the prior year. The gross margin for FY26 stood at 15.6%, compared to 15.7% in FY25.
Balance Sheet Highlights
The company's total assets grew to ₹1,471.00 crores as of March 31, 2026, from ₹1,223.43 crores in the previous year. Total equity stood at ₹688.42 crores, up from ₹583.65 crores. The key balance sheet figures are summarised below:
| Particulars: |
31-Mar-26 (₹ Cr) |
31-Mar-25 (₹ Cr) |
| Total Non-Current Assets: |
391.77 |
310.26 |
| Total Current Assets: |
1,079.23 |
913.17 |
| Total Assets: |
1,471.00 |
1,223.43 |
| Total Equity: |
688.42 |
583.65 |
| Total Non-Current Liabilities: |
213.69 |
181.09 |
| Total Current Liabilities: |
568.89 |
458.69 |
| Total Equity and Liabilities: |
1,471.00 |
1,223.43 |
Inventories increased to ₹840.40 crores from ₹698.16 crores, while cash and cash equivalents stood at ₹30.29 crores as of March 31, 2026. Current borrowings rose to ₹330.66 crores from ₹278.35 crores.
Cash Flow Summary
The company generated net cash from operating activities of ₹74.95 crores for the year ended March 31, 2026, compared to a net cash outflow of ₹40.82 crores in the previous year. Net cash used in investing activities was ₹49.31 crores, while net cash used in financing activities stood at ₹21.46 crores. Cash and cash equivalents at the end of the period were ₹30.29 crores, up from ₹26.11 crores at the beginning of the period. Disciplined working capital management has turned cash flows positive, strengthening the balance sheet.
Operational Performance
The investor presentation provided detailed operational metrics for FY26. Same store sales growth stood at 8% for FY26, while H2 FY26 same store sales growth accelerated to 18% compared to 16% in H2 FY25. Bill cuts (number of transactions) rose to 1,190 lacs in FY26 from 1,001 lacs in FY25, a growth of 18.9%. The average selling price for FY26 was Rs. 22,088, up 0.9% from Rs. 21,894 in FY25.
| Operational Metric: |
H2 FY26 |
H2 FY25 |
FY26 |
FY25 |
| Same Store Sales Growth (%): |
18% |
16% |
8% |
15% |
| Bill Cuts (Nos. in Lacs): |
570 |
431 |
1,190 |
1,001 |
| Average Selling Price (Rs.): |
21,406 |
21,521 |
22,088 |
21,894 |
The H1:H2 revenue split improved from 56%:44% in FY25 to 52%:48% in FY26, reflecting the company's transition to a more year-round demand model. Q3 festive demand combined with Q4 early summer demand has made H2 as powerful as H1.
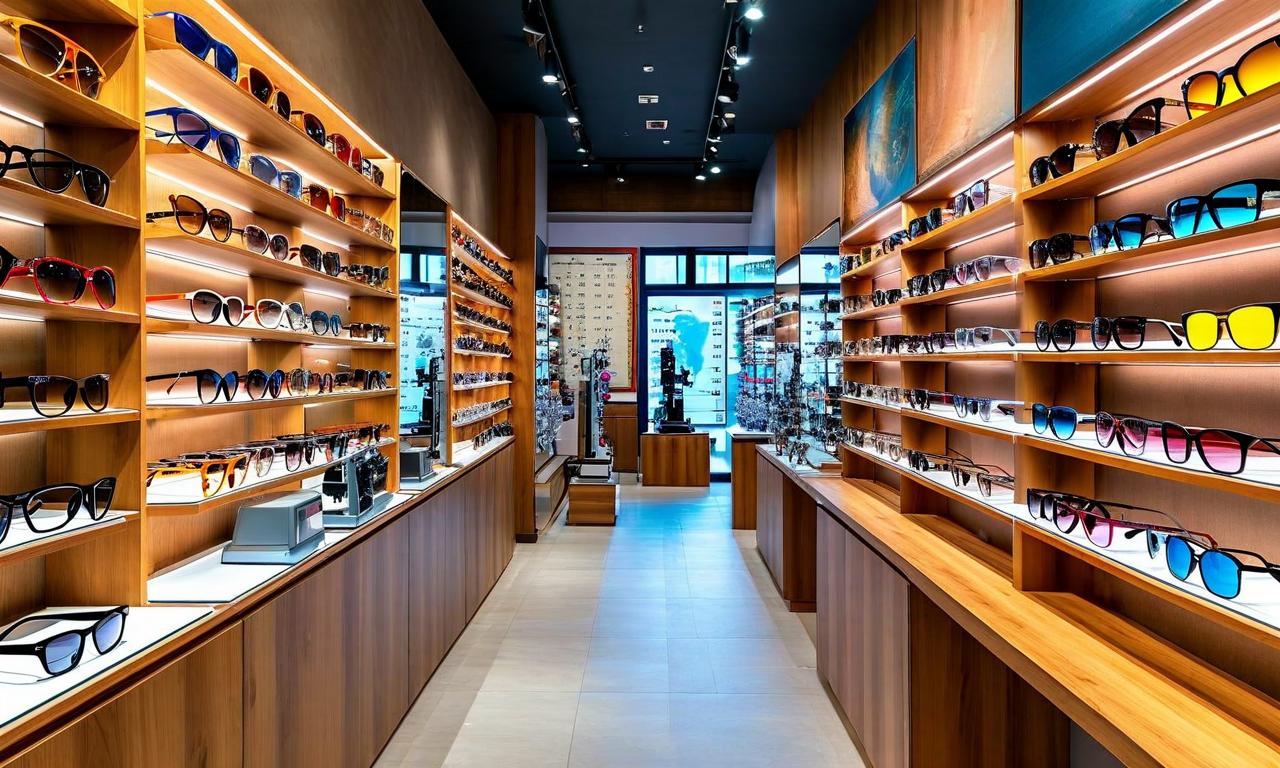
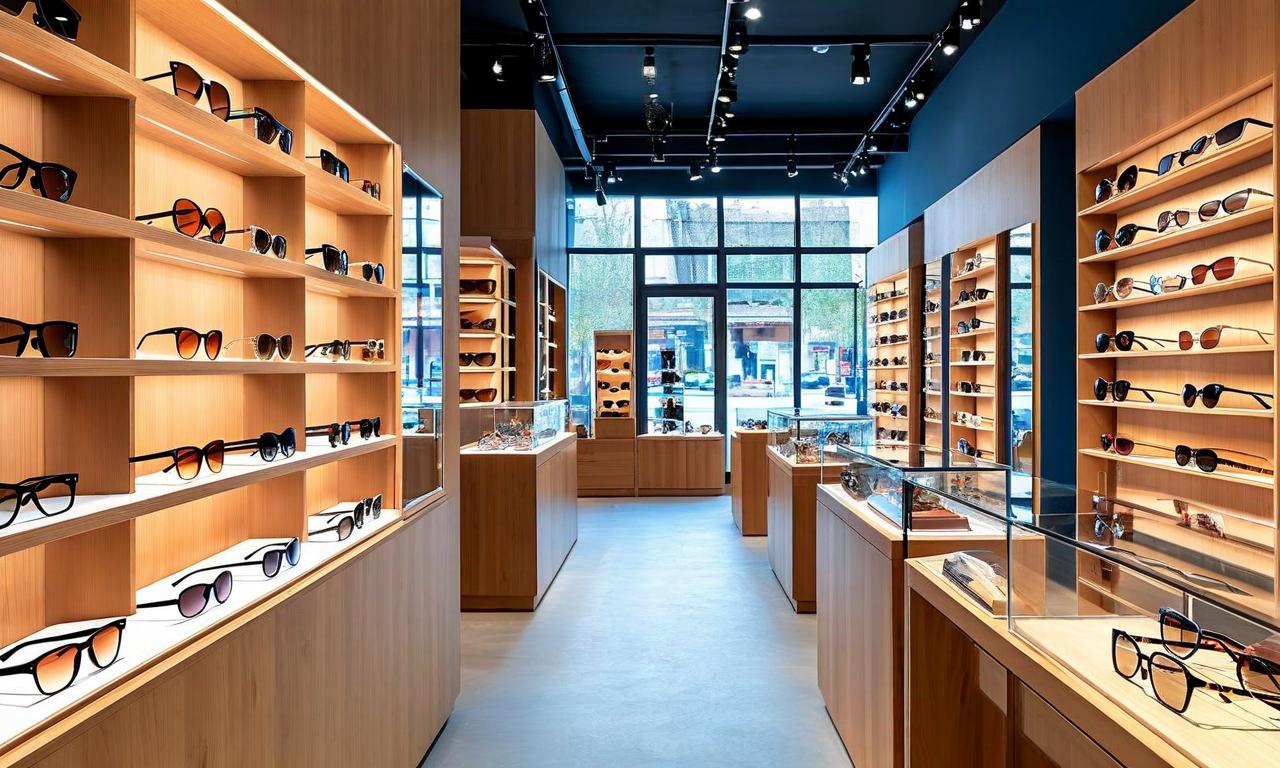
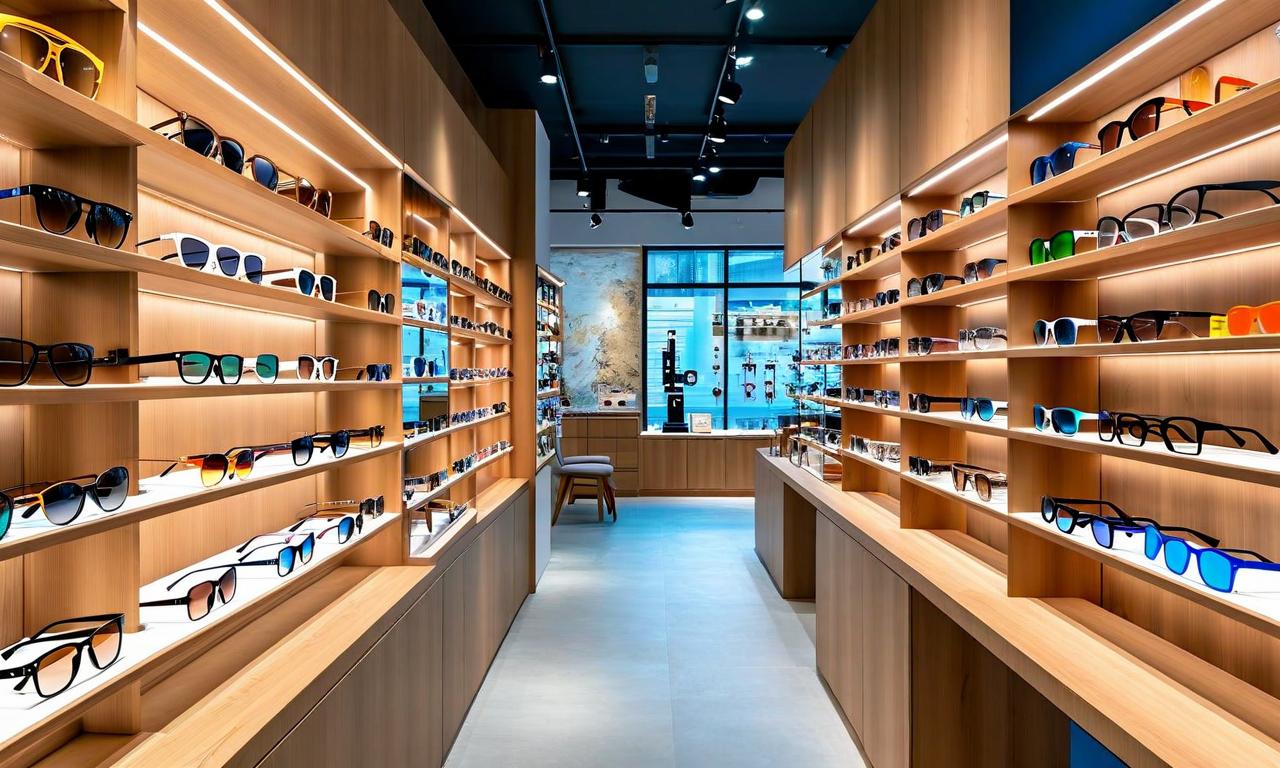
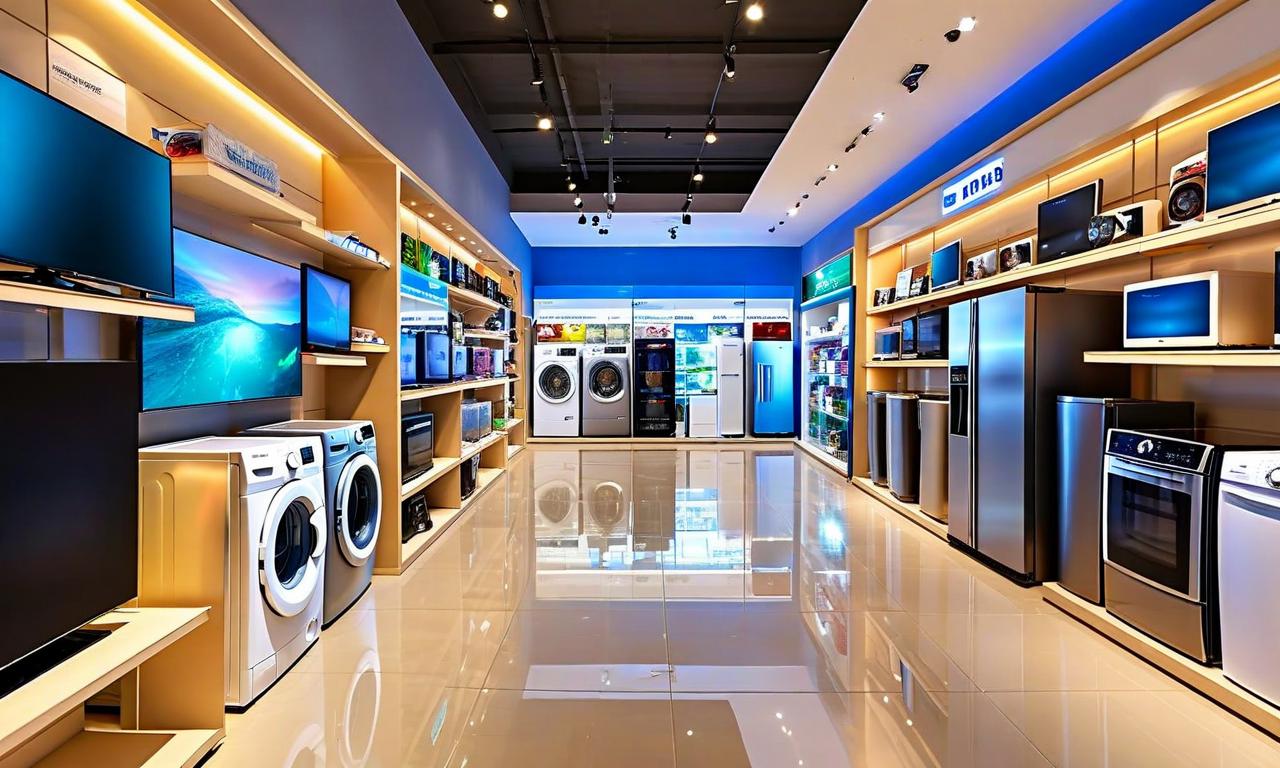
Store Expansion and Retail Footprint
As of March 31, 2026, Aditya Vision operated 207 showrooms with an average store size of 4,400+ sq ft and a total retail footprint of approximately 9.1 lakh sq ft. The company has maintained a zero store closure record since inception. Notably, 102 stores were added in just the last 3 years, nearly matching the 105 stores built over the preceding 24 years. The state-wise store distribution is presented below:
| State: |
Stores |
Cities |
Districts Covered |
| Bihar: |
118 |
69 cities |
All 38 districts |
| Uttar Pradesh: |
53 |
24 cities |
30 out of 75 districts |
| Jharkhand: |
33 |
25 cities |
22 out of 24 districts |
| Chhattisgarh: |
3 |
3 cities |
2 out of 33 districts |
The company entered Chhattisgarh in FY26 and has planned entry into Madhya Pradesh in FY27. Aditya Vision holds over 50% market share in Bihar as per a Crisil Report and is the largest electronic retailer in Jharkhand.
Business Economics and Historical Performance
The company's business economics reflect consistent margins over the years. Gross margin has expanded from 10.7% in FY20 to 15.6% in FY26, supported by 85% direct OEM supply which drives higher margins. Employee cost as a percentage of sales has remained stable at 3.1% in FY26. Revenue has grown at a CAGR of 31% from FY22 to FY26, while EBITDA and PAT have grown at CAGRs of 29% and 35% respectively over the same period.
| Metric: |
FY22 |
FY23 |
FY24 |
FY25 |
FY26 |
| Revenue (₹ Cr): |
899 |
1,322 |
1,743 |
2,260 |
2,672 |
| EBITDA (₹ Cr): |
83 |
133 |
167 |
204 |
228 |
| EBITDA Margin (%): |
9.2% |
10.1% |
9.6% |
9.0% |
8.5% |
| PAT (₹ Cr): |
35 |
64 |
77 |
105 |
117 |
| PAT Margin (%): |
3.9% |
4.9% |
4.4% |
4.7% |
4.4% |
Market Context and Growth Drivers
The investor presentation cited several macro tailwinds supporting Aditya Vision's growth. According to the CMS Consumption Report 2025, average monthly spending on consumer durables soared by 72% in FY25, with increasing financing options and no-cost EMIs helping to boost consumption. Rising temperatures are expected to have a significant impact on the growth of the consumer durables market, particularly room ACs and refrigerators, while increasing smart appliances adoption among youth and urban areas is supporting premiumisation. The company's Hindi Heartland focus positions it to benefit from rising prosperity in underpenetrated states. Uttar Pradesh, with a population of approximately 24 crore accounting for ~17% of India's population, is India's 3rd largest economy with a Gross State Domestic Product of Rs. 29.6 Lakh Crore in FY25. Bihar's per capita income increased to Rs. 73,700 during 2024-25 from Rs. 47,770 in 2021-22, while Chhattisgarh's per capita income stood at Rs. 1,62,870 in FY25E, the fastest growing in the Hindi belt.
Analyst and Investor Call
Following the board meeting on Friday, May 08, 2026, Aditya Vision made available the audio recording of the Analysts/Investors Call pertaining to the Standalone Audited Financial Results for the quarter and year ended March 31, 2026. The recording has been submitted to BSE Limited and the National Stock Exchange of India Limited in compliance with Regulation 30. The audio recording is accessible at the following link: https://adityavision.in/media/audios/2026/05/08/10042838.mp3 . The submission was authenticated by Akanksha Arya, Company Secretary, on May 08, 2026.
Dividend and Compliance
The board recommended a final dividend of 125%, amounting to ₹1.25 per share of ₹1 each, subject to shareholder approval at the ensuing AGM. The results were prepared in accordance with the Companies (Indian Accounting Standards) Rules 2015 (IND AS) under Section 133 of the Companies Act, 2013. The company's business activity falls within a single primary business segment of retail of electronic products.


 20
20