

Gland Pharma FY26 Results: Net profit surges 47% to ₹10,273 mn


- Consolidated revenue rose 14% YoY to ₹64,307 million in FY26
- Net profit surged 47% to ₹10,273 million, with PAT margin expanding to 16%
- EBITDA grew 28% to ₹16,295 million, reflecting a 25% margin
- European subsidiary Cenexi narrowed losses significantly as revenues grew 25%
- US market remained the largest contributor with ₹34,214 million in revenue



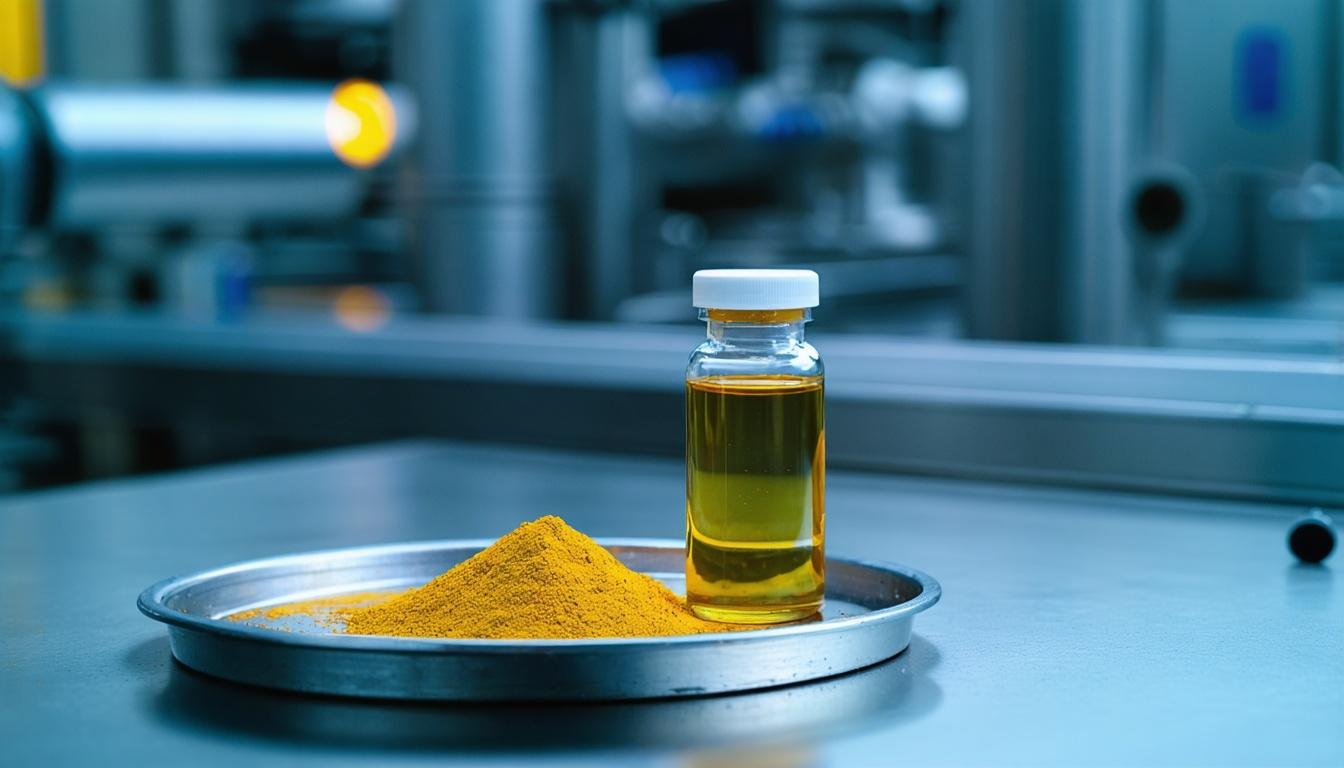
*this image is generated using AI for illustrative purposes only.
Gland Pharma delivered a robust financial performance for the fiscal year ended March 2026, reporting a consolidated revenue of ₹64,307 million and a net profit after tax (PAT) of ₹10,273 million. The results reflect a year of meaningful margin expansion and operational efficiency across its global sterile injectable manufacturing business.
The company held its 48th Annual General Meeting on August 25, 2026, where Executive Chairman Srinivas Sadu outlined the strategic progress made during FY26. Shareholders approved the audited standalone and consolidated financial statements, along with the declaration of a final dividend. The meeting was conducted via video conferencing, complying with SEBI regulations.
Financial Performance Highlights
Gland Pharma’s top-line growth was supported by strong demand in key regulated markets, particularly the US and Europe. The company achieved an EBITDA of ₹16,295 million, representing a margin of 25%, which marks a significant improvement from the previous year.
| Metric | FY26 (₹ Mn) | FY25 (₹ Mn) | YoY Change |
|---|---|---|---|
| Revenue from Operations | 64,307 | 56,165 | 14% |
| Gross Profit | 41,877 | 35,261 | 19% |
| EBITDA | 16,295 | 12,689 | 28% |
| EBITDA Margin | 25% | 23% | +200 bps |
| PAT | 10,273 | 6,985 | 47% |
| PAT Margin | 16% | 12% | +400 bps |
Other income also saw substantial growth, rising 48% year-on-year to ₹3,163 million, contributing to a total income increase of 16% to ₹67,470 million.
Regional Growth Drivers
The US market remained the primary growth engine, contributing ₹34,214 million in revenue, up 13% from the previous year. This performance was bolstered by the launch of 31 new molecules, reinforcing the company’s market leadership in North America.
Europe recorded the highest growth rate among major regions, with revenue jumping 34% to ₹14,035 million. Other core markets, including Canada, Australia, and New Zealand, grew by 12% to ₹2,269 million. The Rest of the World segment contributed ₹11,117 million, while domestic operations in India generated ₹2,672 million.
Cenexi Turnaround
A key highlight of the fiscal year was the decisive turnaround at Cenexi, the company’s European subsidiary. Cenexi revenues grew by 25% to ₹18,693 million (€182 million). More importantly, operational efficiencies led to a significant improvement in EBITDA, narrowing the loss to ₹336 million (€3 million) compared to a loss of ₹1,761 million (€19 million) in FY25. The EBITDA margin improved from -12% to -2%.
What the Numbers Show
The divergence between revenue growth (14%) and PAT growth (47%) underscores the impact of operational leverage and cost discipline. With gross profit margins expanding from 63% to 65%, the company successfully translated higher volumes into disproportionately higher bottom-line profits. Additionally, the sharp reduction in Cenexi’s losses indicates that integration efforts are beginning to yield tangible financial benefits, reducing drag on consolidated earnings.
Strategic Outlook and ESG
Looking ahead, Gland Pharma is focusing on six strategic levers, including strengthening its Contract Development and Manufacturing Organization (CDMO) capabilities, expanding its complex injectables portfolio, and leveraging Cenexi as a platform for European growth. The company continues to invest in R&D, spending ₹2,230 million during the year, and has filed 24 new Abbreviated New Drug Applications (ANDAs).
On the sustainability front, the company reported conserving 5.79% in energy and recycling 51.03% of its water usage. It also executed 21 Corporate Social Responsibility (CSR) projects, benefiting over 61,000 individuals, aligning with United Nations Sustainable Development Goals.
Historical Stock Returns for Gland Pharma
| 1 Day | 5 Days | 1 Month | 6 Months | 1 Year | 5 Years |
|---|---|---|---|---|---|
| -3.02% | -0.59% | +0.39% | +68.17% | +45.12% | -21.95% |

How will the ongoing turnaround at Cenexi impact Gland Pharma's consolidated EBITDA margins in FY27, and when is the subsidiary expected to break even?
Given the strong US demand, what specific regulatory or competitive risks could threaten Gland Pharma's market leadership in North America over the next 12-18 months?
To what extent will the expansion of CDMO capabilities contribute to revenue diversification, and how does this segment's growth trajectory compare to traditional sterile injectables?
 16
16








 Create Custom Screeners
  Access 200+ Pre-built Filters
  Use 50+ Readymade Screener





