Latest news about Nesco

Nesco
1,094.00
+9.80(+0.90%)
Company Performance:
View Company Insights1D+0.90%
1M-2.27%
6M-7.49%
1Y-14.70%
5Y+72.47%


More news about Nesco


25May 26
Nesco to transfer unclaimed shares to IEPF
Nesco Limited announced the transfer of unpaid dividends and shares from FY 2018-19 to the IEPF Authority due to seven years of unclaimed status. Shareholders must submit claims with valid documents by 25 August 2026 to KFintech to avoid the transfer. Post-transfer, recovery is possible only via Form IEPF-5.
23May 26
Nesco to transfer unclaimed shares to IEPF Authority
Nesco Limited announced the transfer of unpaid and unclaimed dividends and equity shares from FY 2018-19 to the IEPF Authority due to seven years of non-claim. Shareholders must submit claims with required documents to the Registrar by August 25, 2026, to prevent the transfer. Post-transfer, claims must be made directly to the IEPF Authority via Form IEPF-5.
15Apr 26
Nesco Limited Issues Official Statement on Exhibition Center Incident Investigation
Nesco Limited has released an official press statement following the arrest of its Vice President and investigation into an exhibition center incident that resulted in fatalities. The company strongly defends its operations, maintains it followed all safety protocols, and expresses confidence that the investigation will clear its employees of wrongdoing.
09Apr 26
Nesco Limited Schedules Board Meeting for May 25, 2026 to Review Q4FY26 and Annual Financial Results
Nesco Limited has scheduled a board meeting for May 25, 2026, to consider and approve audited standalone and consolidated financial results for Q4FY26 and the full financial year ended March 31, 2026. The meeting will also review audit reports and potential final dividend recommendations. The company has implemented a trading window closure from April 1 to May 27, 2026, in compliance with regulatory requirements.
19Mar 26
NESCO Officially Announces ₹1,000 Crore Revenue Milestone via Regulatory Filing
NESCO Limited has officially announced achieving ₹1,000 crore revenue milestone in the current financial year through a regulatory filing to stock exchanges under SEBI Regulation 30. The announcement, made on March 19, 2026, highlights the company's strong growth momentum and operational performance, marking a significant step in its growth journey.
03Feb 26
Nesco Limited Opens Special Window for Transfer and Dematerialisation of Physical Securities
Nesco Limited has opened a special window for transfer and dematerialisation of physical securities from February 05, 2026 to February 04, 2027, following SEBI Circular dated January 30, 2026. The facility covers securities sold or purchased prior to April 01, 2019 that were previously rejected due to document deficiencies. Investors can re-lodge transfer deeds through RTA MUFG Intime India Private Limited with complete documentation.
27Jan 26
NESCO Reports Mixed Q3 Results with Revenue Growth and Profit Decline
NESCO reported mixed third quarter results with revenue growing 20.8% year-on-year to ₹2.5 billion from ₹2.07 billion, while net profit declined 5.5% to ₹1.04 billion from ₹1.1 billion in the corresponding quarter last year. The results demonstrate strong top-line growth offset by margin pressure affecting bottom-line performance.
27Dec 25
Nesco Ltd Completes Routine GST Search by Maharashtra Tax Office
Nesco Limited has completed routine GST search operations conducted by Maharashtra State tax authorities, with the company extending full cooperation throughout the process. The regulatory disclosure confirms no further material updates are required under SEBI Listing Regulations, indicating satisfactory resolution of the tax examination.
19Nov 25
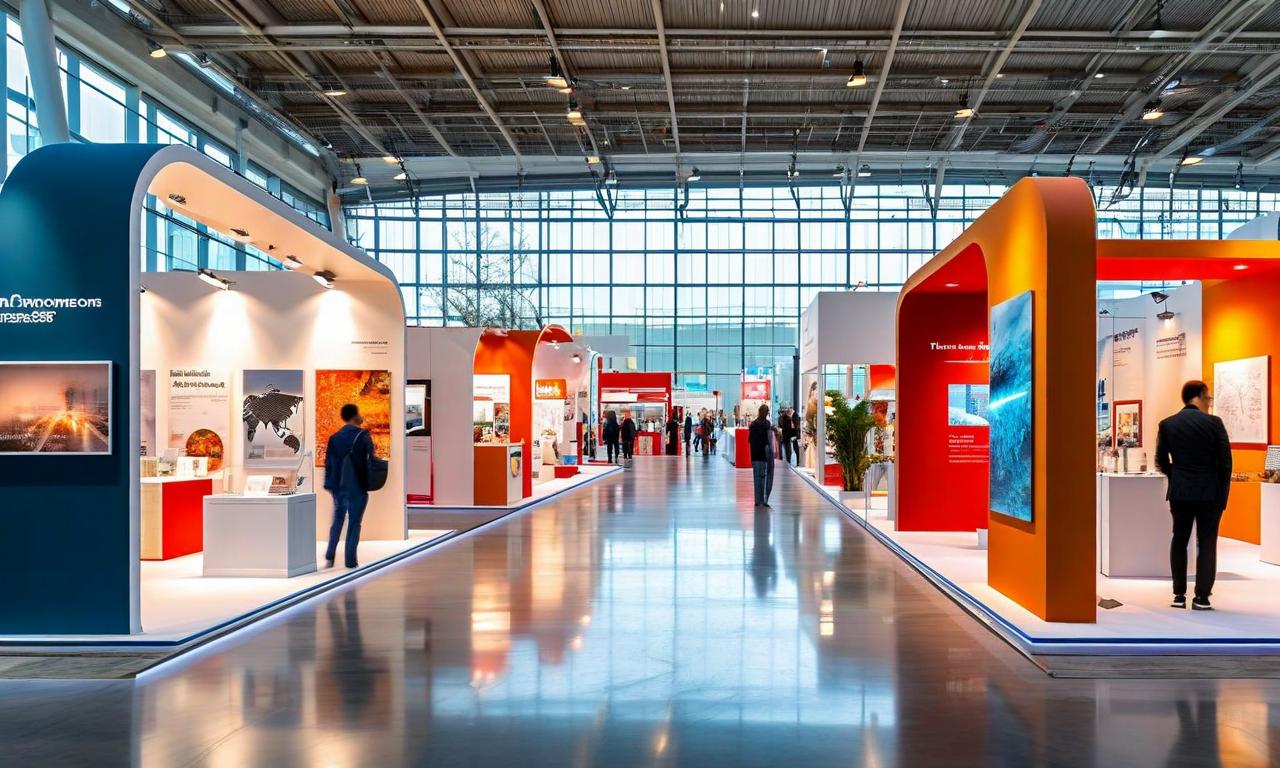
Nesco Limited Showcases Diversified Portfolio at Kotak Midcap Conference 2025
Nesco Limited, a diversified company, will present at the Kotak Midcap Conference 2025 in Mumbai. The presentation will highlight Nesco's varied business interests including IT parks, exhibition centers, events, food services, engineering, and wayside amenities. The company plans to showcase its strategic expansion plans across these verticals, demonstrating its intent to capitalize on emerging opportunities in India's business landscape. This participation underscores Nesco's commitment to transparent investor communication.
06Nov 25
NESCO Reports Robust Q2 Growth with 26% Revenue Surge and 9% Profit Increase
Nesco Limited announced robust Q2 results with revenue rising 26% year-over-year to ₹2.40 billion and net profit increasing 9% to ₹1.20 billion. EBITDA improved to ₹1.40 billion, though the margin slightly decreased. The Realty segment led revenue generation at ₹100.14 crore, followed by the Bombay Exhibition Center at ₹75.01 crore. As of September 30, the company's total assets stood at ₹3,353.12 crore with total equity of ₹2,798.75 crore.
03Nov 25
NESCO Revises Wayside Amenities Project, Proceeds with Single Site for ₹75 Crore Investment
Nesco Limited has revised its Wayside Amenities Project with National Highways Logistics Management Limited (NHLML), abandoning two of three initially awarded locations in the South Zone due to feasibility issues. The company will proceed with developing one site on the Bengaluru Chennai Expressway Corridor, investing ₹75 crore. The project is expected to generate annual revenue of ₹115 crore from the fourth year of operations, with an annual lease rent of ₹5.53 crore subject to revisions based on WPI and CPI increases. NHLML has accepted the surrender of two sites without financial implications for Nesco.
18Aug 25
Nesco Limited Showcases Strong Growth and Expansion Plans at Equirus Annual India Conference 2025
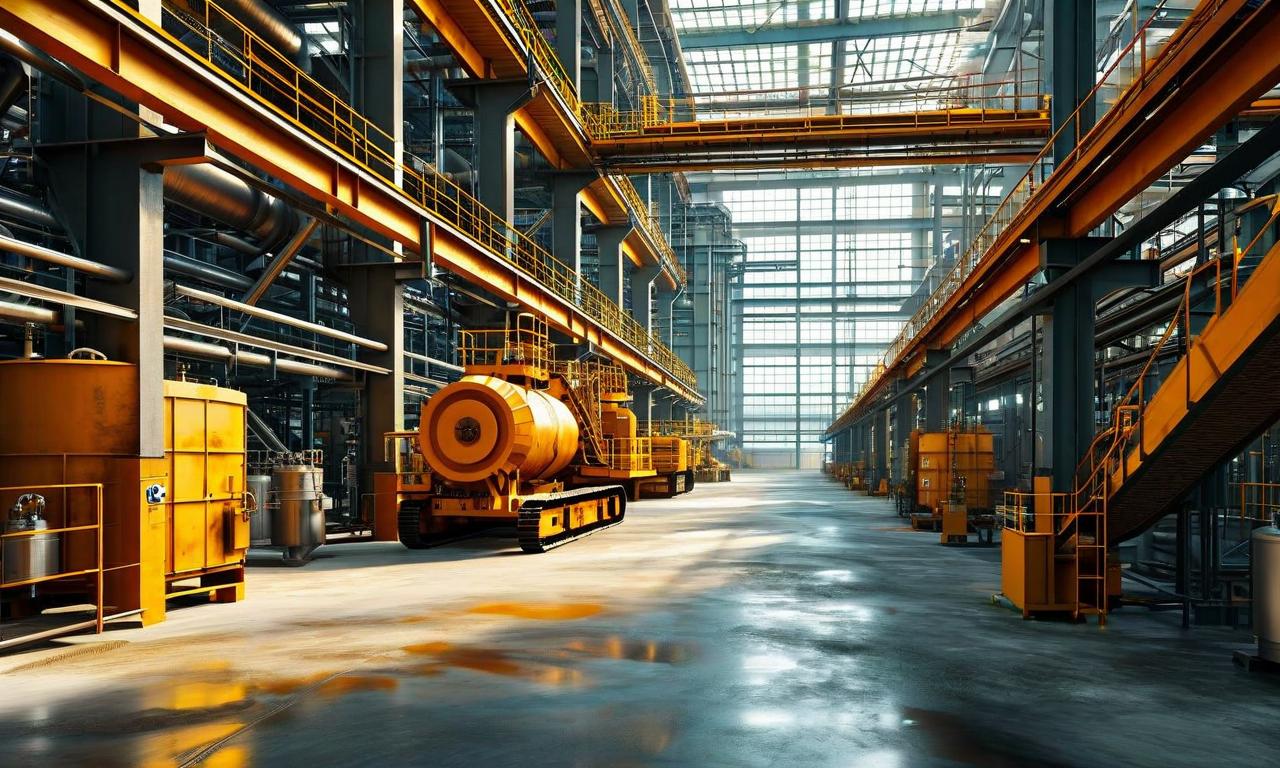
Nesco Limited reported impressive financial results for FY2025, with total income of ₹845 crores, up 7.90% YoY. The company's IT park business achieved 100% occupancy in Towers 3 and 4, housing over 25,000 employees from prestigious clients. The exhibition and events segment generated ₹174 crores in FY2024-25. Expansion plans include a new IT park development with 1.65 million sq. ft. of chargeable office space, entry into wayside amenities with 11 sites, and a hotel project with 732 rooms. Nesco emphasizes sustainability with 100% renewable energy usage in its IT parks and various green certifications.
30Jul 25
NESCO Reports Robust 37.5% Growth in Q1 Net Profit, Reaches ₹96.20 Crore
Nesco Limited's Q1 financial results show strong performance across segments. Net profit increased by 37.5% to ₹96.20 crore, while total income rose 29.6% to ₹221.45 crore. The realty segment remained the largest contributor with ₹98.49 crore revenue. Bombay Exhibition Center and Foods segments showed significant growth. The company's profit before tax increased to ₹123.88 crore, with total assets at ₹3,180.67 crore and net worth at ₹2,725.64 crore.
16May 25
NESCO Reports Mixed Q4 Results, Declares Final Dividend of ₹6.50 Per Share
NESCO Ltd. released its Q4 financial results, showing a slight revenue increase to ₹1.92 billion, up 1.6% year-over-year. However, EBITDA decreased to ₹1.07 billion, with the margin contracting to 55.56%. Net profit declined by 15.6% to ₹886.20 million. Despite the profit drop, the company announced a final dividend of ₹6.50 per share, demonstrating commitment to shareholder value.
Industry Peers International Gemological Institute
 WeWork India ManagementNesco
 Indiabulls
 SIS
SIS Nirlon
 Smartworks Coworking Spaces
 CMS Info Systems
 Quess Corp
 Hemisphere Properties
346.35
(-1.17%)
677.95
(-6.88%)
1,094.00
(+0.90%)
28.99
(-3.66%)
433.60
(-1.51%)
621.60
(+0.26%)
455.50
(-1.80%)
275.65
(+2.82%)
290.95
(-0.87%)
137.18
(+0.67%)


 we are part of Raise Financial Services
built with love
for indians who love to invest & trade
Market Community

Follow us on

