Sahyadri Industries Reports 18.3% Revenue Growth in Q2FY26 Amid Seasonal Challenges


Sahyadri Industries Limited announced Q2FY26 results with total income up 18.3% YoY to Rs 126.30 crores and PAT increasing 40.4% to Rs 2.70 crores. EBITDA margin declined to 8.2% from 9.6% due to higher imported fiber costs and delayed monsoon withdrawal. H1FY26 saw 5.5% revenue growth but 6.5% PAT decrease. The company maintains 73% capacity utilization and plans expansion with new manufacturing units in Orissa and Maharashtra.
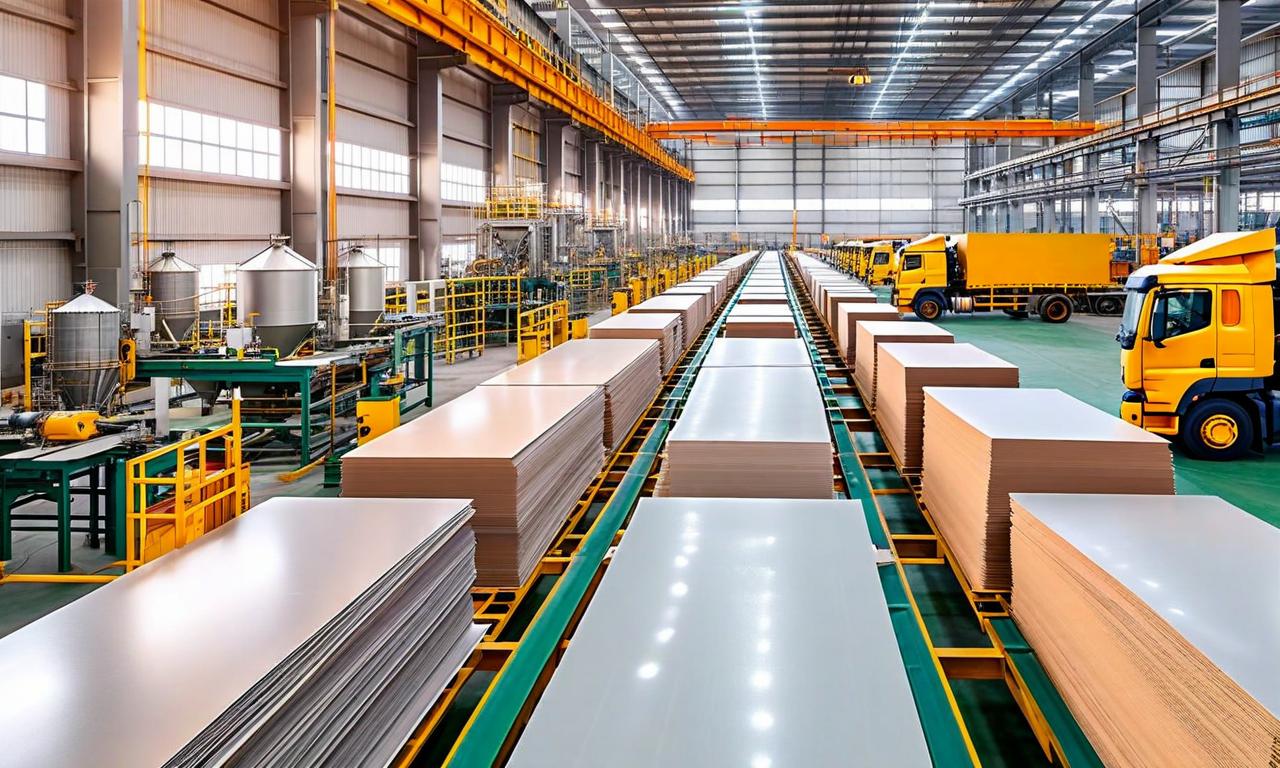

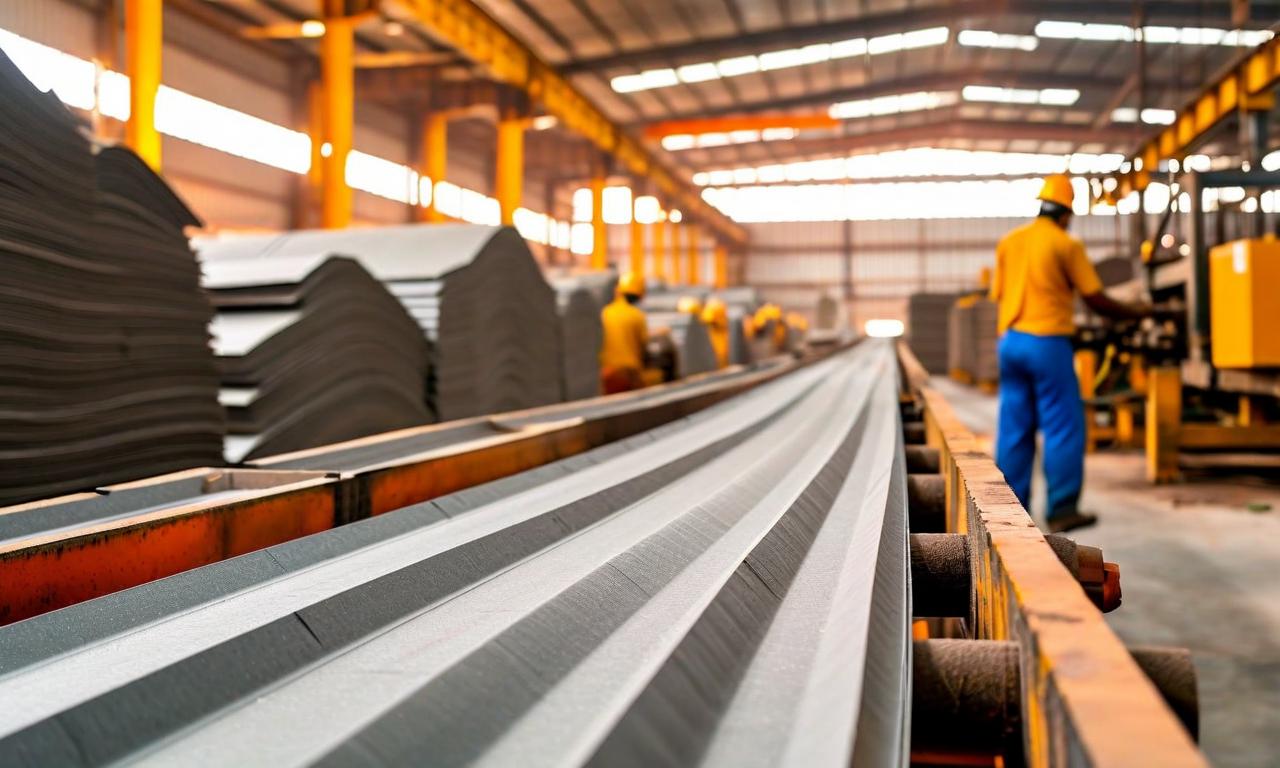
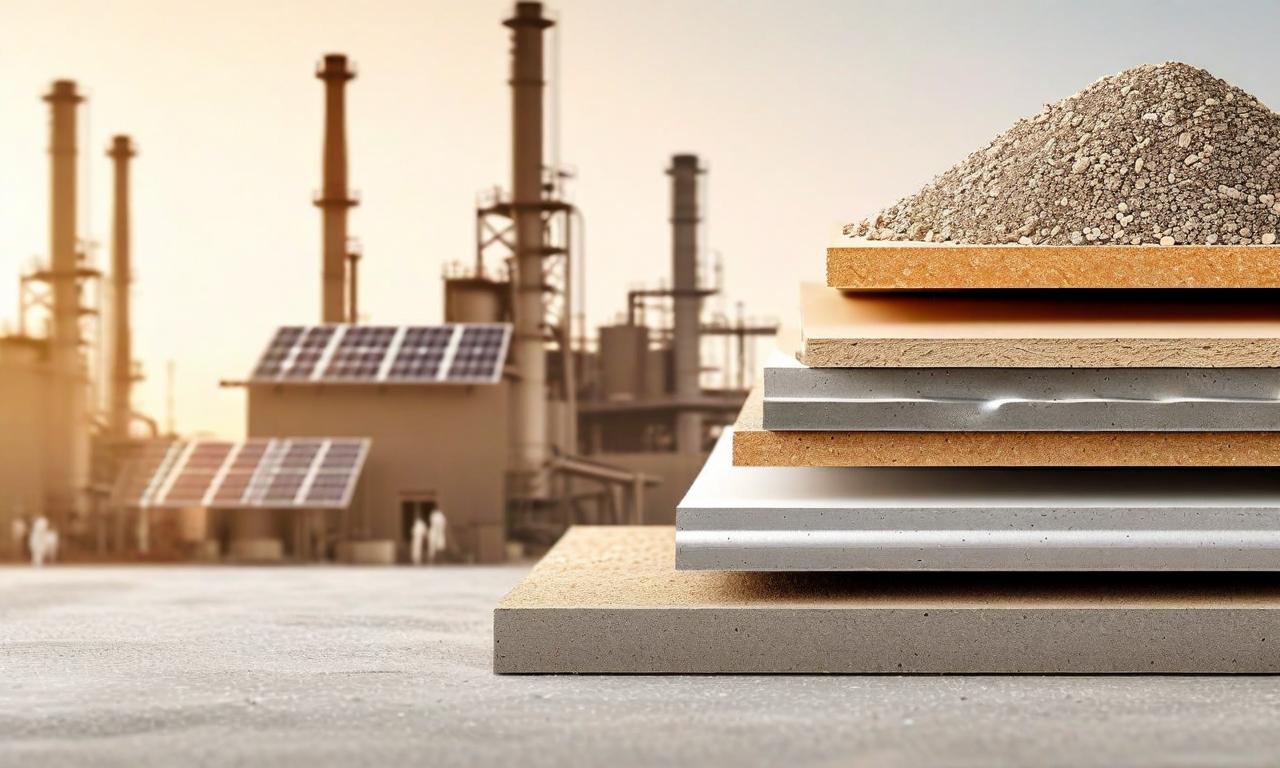
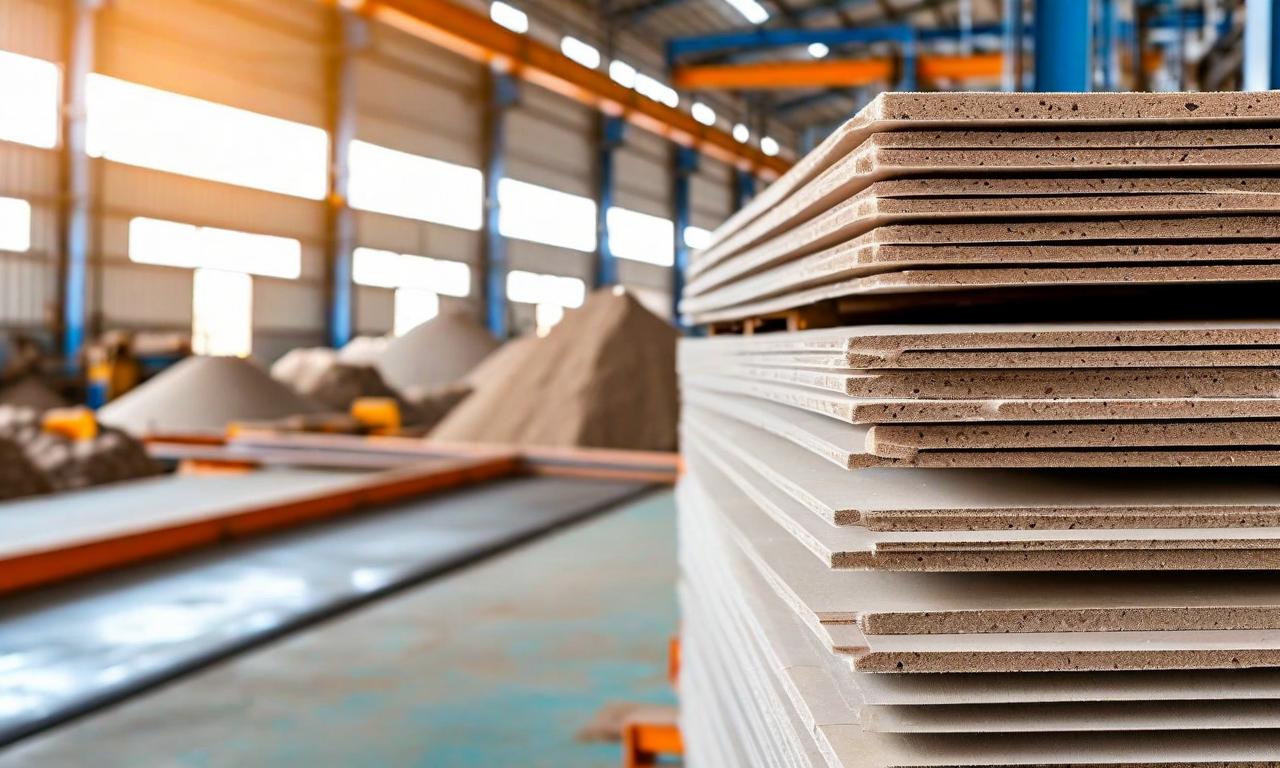
*this image is generated using AI for illustrative purposes only.
Sahyadri Industries Limited , a pioneer in building solutions, has announced its financial results for the second quarter of fiscal year 2026, demonstrating resilience in the face of seasonal headwinds. The company reported significant year-on-year growth in total income and profit after tax, despite facing margin pressures due to external factors.
Financial Highlights
| Particulars (Rs. in Crores) | Q2FY26 | Q2FY25 | YoY Change | H1FY26 | H1FY25 | YoY Change |
|---|---|---|---|---|---|---|
| Total Income* | 126.30 | 106.80 | 18.3% | 342.40 | 324.60 | 5.5% |
| EBITDA | 10.30 | 10.30 | 0% | 32.10 | 35.20 | -8.8% |
| EBITDA Margin | 8.2% | 9.6% | -140 bps | 9.4% | 10.8% | -140 bps |
| Profit After Tax (PAT) | 2.70 | 1.90 | 40.4% | 13.50 | 14.40 | -6.5% |
| PAT Margin | 2.1% | 1.8% | +30 bps | 3.9% | 4.4% | -50 bps |
*Includes other income
Key Performance Insights
Sahyadri Industries demonstrated strong top-line growth in Q2FY26, with total income rising by 18.3% year-on-year to Rs 126.30 crores. This growth came despite the traditionally softer second quarter, which is affected by the nationwide monsoon. The company's profit after tax surged by 40.4% to Rs 2.70 crores in the same period.
However, the company faced margin pressures due to external factors. The EBITDA margin declined to 8.2% in Q2FY26 from 9.6% in the corresponding quarter of the previous year. This compression was attributed to two main factors:
- A stronger US dollar leading to higher imported fiber costs
- Delayed withdrawal of the monsoon affecting overall sales
For the first half of FY26, the company reported a 5.5% increase in total income to Rs 342.40 crores. However, PAT for H1FY26 decreased by 6.5% to Rs 13.50 crores compared to the same period last year.
Operational Performance
The capacity utilization for H1FY26 stood at 73%, indicating room for growth as demand picks up. This metric suggests that the company has the potential to increase production without significant additional capital expenditure in the near term.
Management Commentary
Mr. Satyen Patel, Managing Director of Sahyadri Industries Limited, commented on the results: "Despite these seasonal headwinds, we delivered a resilient operational performance across key financial metrics. In Q2, total income grew by 18.3% YoY and PAT surged by 40.4% YoY. Looking ahead, we will continue to optimize our capacities and maintain a strong focus on cost control measures to enhance operational efficiencies."
Expansion Plans
Sahyadri Industries is actively pursuing expansion strategies to strengthen its market position:
- A new manufacturing unit in Orissa for asbestos corrugated sheets with a capacity of 120,000 MTPA and a capex of Rs 95 crores.
- Another unit in Maharashtra for non-asbestos cement boards with a capacity of 72,000 MTPA and a similar capex of Rs 95 crores.
These expansions aim to cater to unrepresented markets in Eastern and Northern India, as well as to bolster the company's presence in Western India and export markets.
Outlook
While the company faces short-term challenges due to seasonal factors and global economic conditions, its strategic expansions and focus on operational efficiencies position it well for future growth. The management's emphasis on capacity optimization and cost control measures is expected to help navigate the current headwinds and capitalize on the growing demand for building materials in India.
Investors and stakeholders will be watching closely to see how Sahyadri Industries leverages its expanded capacity and navigates the evolving market conditions in the coming quarters.
Historical Stock Returns for Sahyadri Industries
| 1 Day | 5 Days | 1 Month | 6 Months | 1 Year | 5 Years |
|---|---|---|---|---|---|
| -0.10% | +8.76% | +7.39% | +21.71% | +0.33% | -15.94% |
 17
17