

Travel Food Services files first FY26 BRSR report with stock exchanges


- Travel Food Services filed its first BRSR for FY26 on August 25, 2026
- Total energy consumption rose to 88,424 GJ with renewable share at 9.20%
- Workforce stands at 4,477 employees with zero statutory workers
- LTIFR improved to 0.73 from 1.02 in the prior year
- Customer complaints reached 2,612 with 1,217 pending resolution



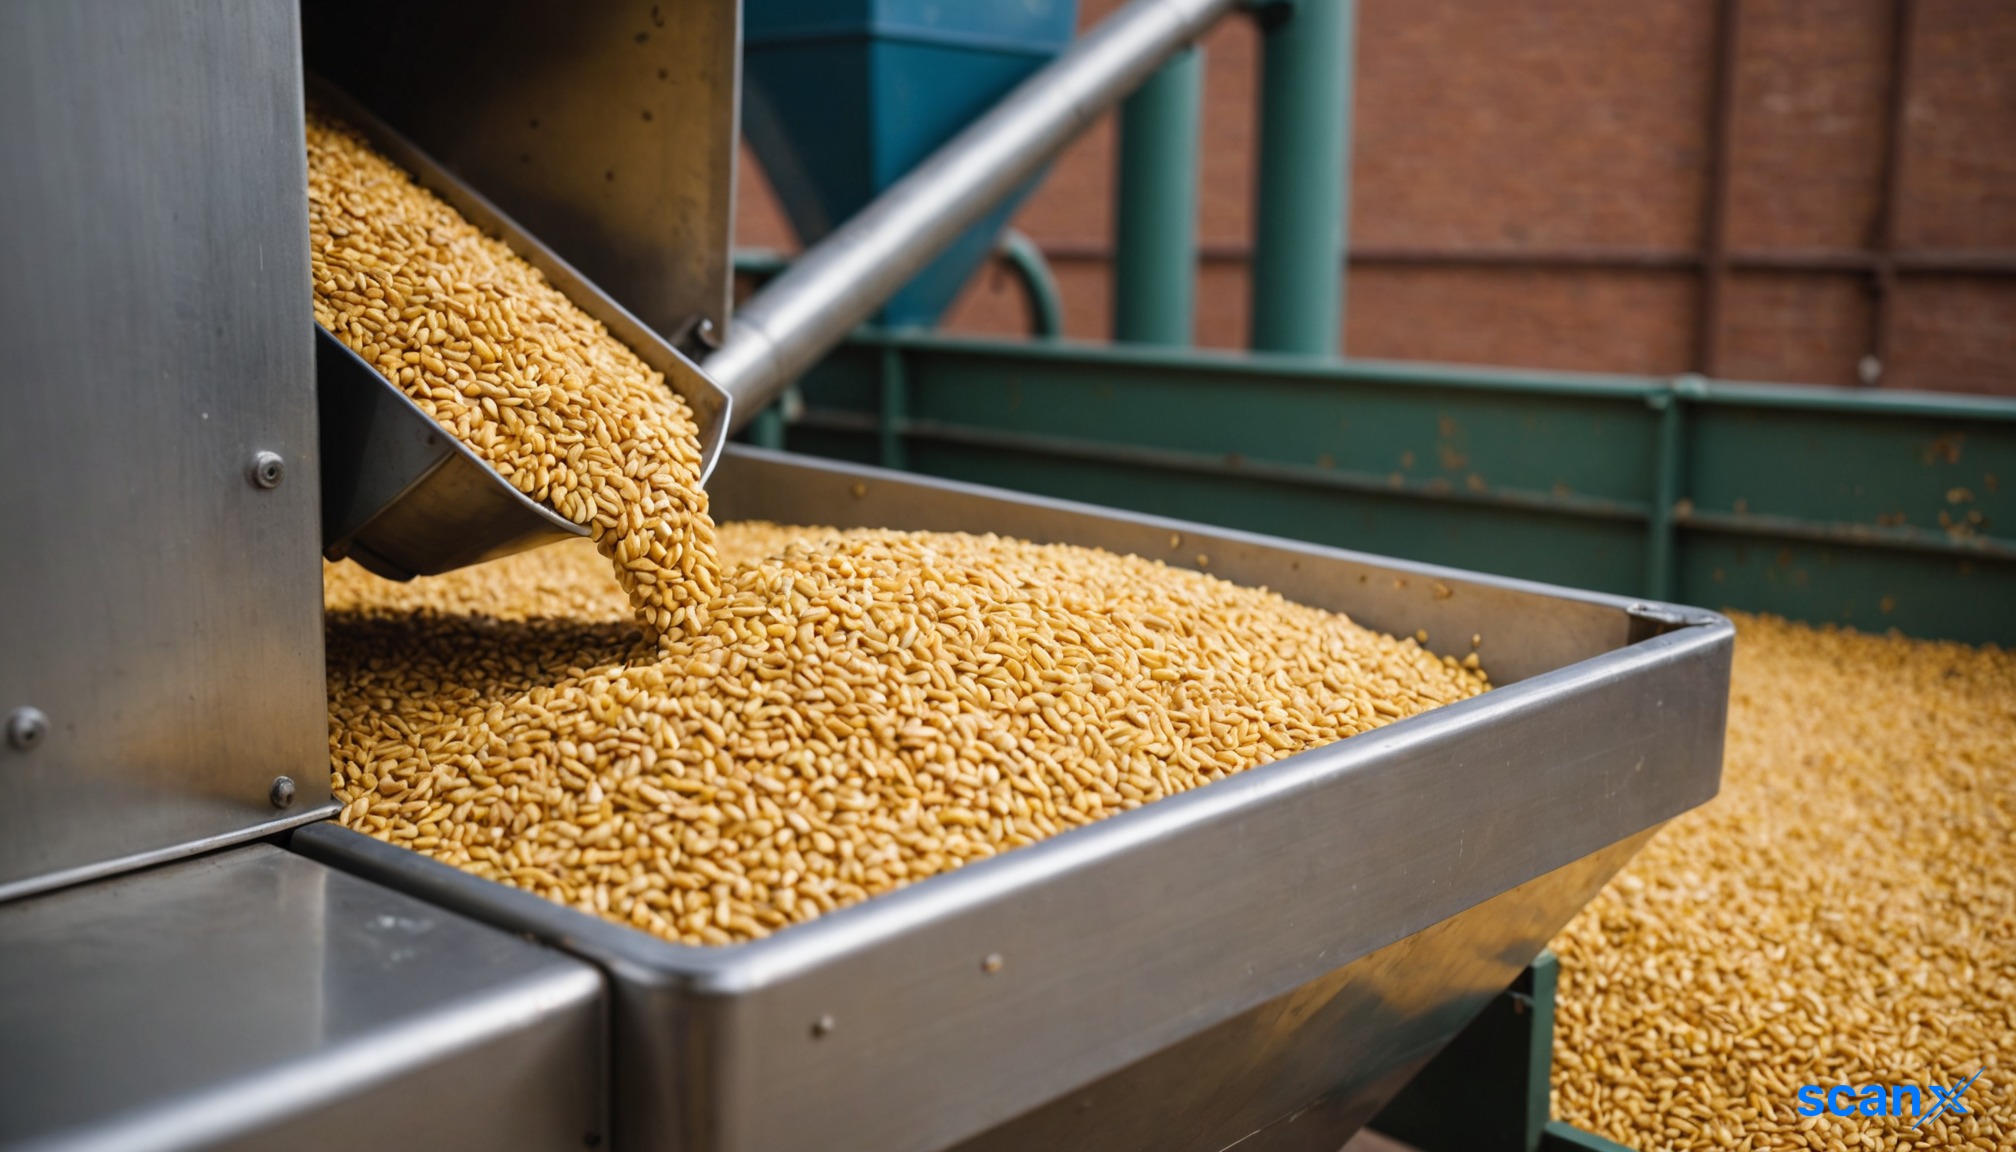
*this image is generated using AI for illustrative purposes only.
Travel Food Services submitted its inaugural Business Responsibility and Sustainability Report (BRSR) for FY26 to the Bombay Stock Exchange and National Stock Exchange on August 25, 2026. The filing covers environmental, social, and governance disclosures aligned with SEBI regulations.
The company reported total energy consumption of 88,424 Giga Joules, with renewable sources accounting for 9.20% of the mix. Scope 1 and Scope 2 greenhouse gas emissions totaled 13,060 metric tonnes of CO2 equivalent.
Operational Metrics
Travel Food Services operates across 284 locations nationally, comprising 245 food and beverage outlets, 13 lounges, 18 land-side stores or warehouses, and 7 central kitchens. The company serves customers in 12 states and one union territory.
| Metric | FY26 | FY25 |
|---|---|---|
| Total Energy Consumption (GJ) | 88,424 | 81,009 |
| Renewable Energy Share (%) | 9.20% | 8.70% |
| Water Withdrawal (KL) | 211,700 | 196,996 |
| Total Waste Generated (MT) | 184.88 | 215.52 |
Employee Welfare and Safety
The workforce stood at 4,477 employees as of March 31, 2026, with no workers in the statutory category. The company reported a Lost Time Injury Frequency Rate (LTIFR) of 0.73 per million person-hours worked, down from 1.02 in the previous year. Eight recordable work-related injuries were reported during the year.
Health insurance and accident insurance coverage extended to 100% of permanent employees. The company incurred costs equivalent to 0.30% of total revenue on employee well-being measures, up from 0.23% in FY25.
What the Numbers Show
Renewable energy consumption grew faster than total energy usage. Renewable sources increased by approximately 15.5% (from 7,048 GJ to 8,133 GJ), while total energy consumption rose by roughly 9.2% (from 81,009 GJ to 88,424 GJ). This divergence indicates a deliberate shift toward cleaner energy sources despite overall operational expansion.
Governance and Compliance
The Board of Directors oversees sustainability matters directly, supported by the Corporate Social Responsibility Committee and Risk Management Committee. The company reported zero material fines or penalties from regulators in FY26. Human rights training covered 100% of employees.
Customer complaints totaled 2,612, with 1,217 pending resolution at year-end. The company attributes outstanding cases primarily to unreachable customers or awaited information for closure.
Historical Stock Returns for Travel Food Services
| 1 Day | 5 Days | 1 Month | 6 Months | 1 Year | 5 Years |
|---|---|---|---|---|---|
| +0.09% | -1.91% | -8.75% | -7.27% | -12.20% | +10.25% |

What specific strategic initiatives is Travel Food Services planning to implement to accelerate its renewable energy share beyond the current 9.20% in the coming fiscal years?
How does the company intend to address the backlog of 1,217 pending customer complaints to improve service resolution times and overall customer satisfaction metrics?
Given the 9.2% increase in total energy consumption alongside operational expansion, what measures are being taken to improve energy efficiency per outlet to decouple growth from resource usage?
 15
15






 Access Market Heat-map & Insights
  Create, Save & Share your Screener
  Use 200+ Screening Filters





