

IREN shares slide 8.35% as investors exit growth names


IREN Ltd shares fell 8.35% to $54.25 on Tuesday as investors exited growth and AI infrastructure names ahead of the May CPI report. The decline is driven by fears that firm inflation could delay Fed rate cuts and rising geopolitical tensions. Despite the pullback, the stock remains above its 50-day and 200-day SMAs, with key resistance at $59.00 and support at $46.00.



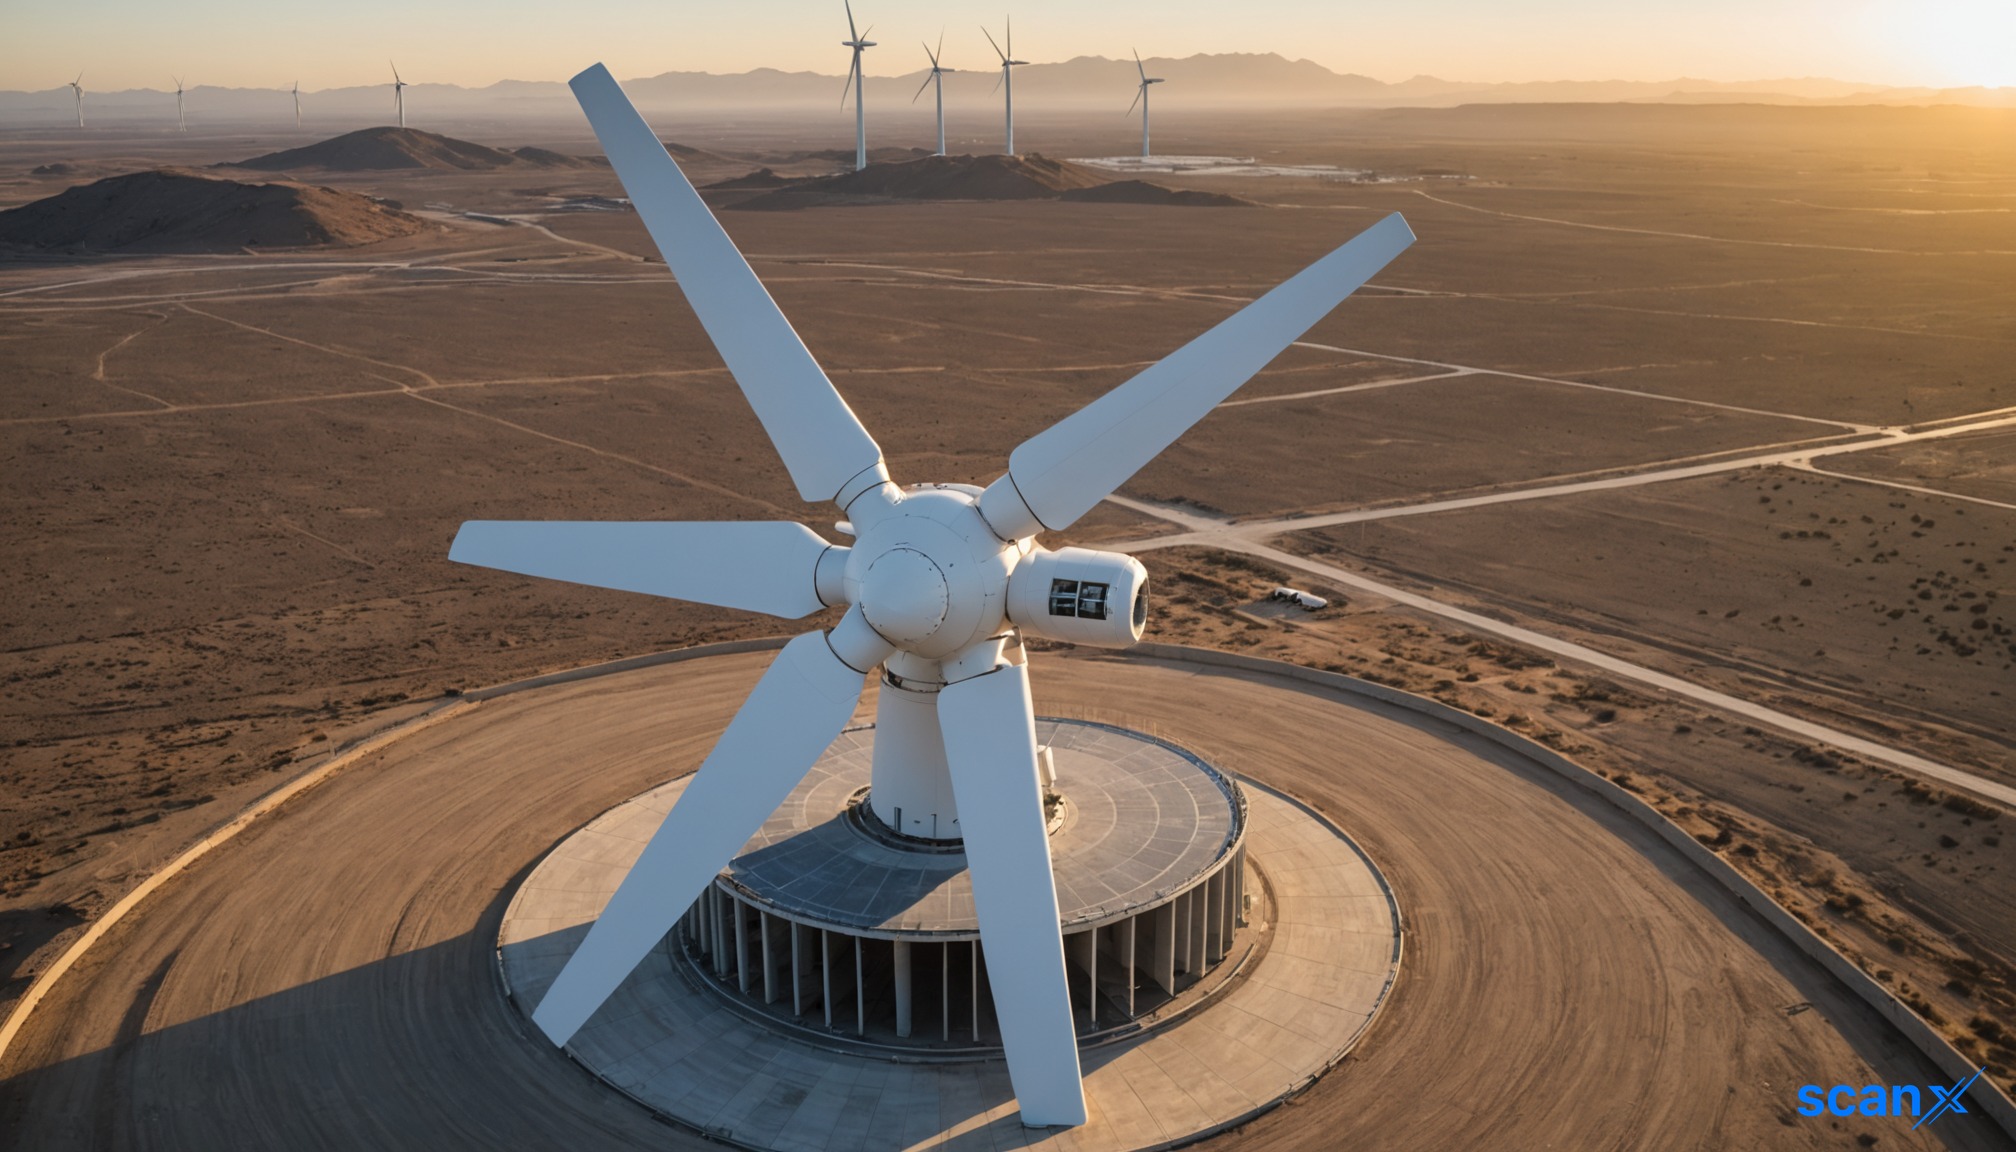
*this image is generated using AI for illustrative purposes only.
IREN Ltd shares declined 8.35% to $54.25 on Tuesday as investors moved out of growth and AI infrastructure names ahead of the May CPI report. The drop reflects concerns that another firm inflation reading could push Federal Reserve rate cuts further out, a scenario that typically hurts capital-intensive companies like IREN. Sentiment weakened further after geopolitical tensions rose following a U.S. helicopter incident over the Strait of Hormuz, raising fears of an oil price spike that could complicate the Fed's path.
IREN is also experiencing a broader pullback in crypto-related equities, with Bitcoin weakness often dragging down the group. However, IREN formally pivoted away from Bitcoin mining last year, pausing expansion to focus on AI cloud and high-performance computing data centers. The market has not fully adjusted to this shift, and the stock continues to trade like a crypto proxy despite its new business direction.
From a technical perspective, IREN remains in an intermediate uptrend but is approaching a decision-point zone. The stock is trading 7.6% below its 20-day SMA at $58.60, while holding 7.6% above its 50-day SMA at $50.32 and 15.3% above its 200-day SMA at $46.97. The RSI sits at 52.46, indicating a neutral momentum consistent with a cooling-off phase rather than a breakdown.
Key Technical Levels
The moving-average backdrop remains supportive, with the 20-day SMA above the 50-day SMA and a golden cross in May signaling a longer-term bullish bias. Key levels are emerging as price compresses between short-term overhead supply and longer-term support.
| Level | Price | Description |
|---|---|---|
| Key Resistance | $59.00 | Round-number area aligning with the 20-day SMA zone |
| Key Support | $46.00 | Floor near the 200-day SMA of $46.97 |
The recent swing high in June and an earlier overbought RSI condition in May suggest rallies may face faster profit-taking. Investors are watching the $59.00 resistance and $46.00 support levels closely as the CPI data release approaches.

How might the market's perception of IREN shift if the upcoming CPI report shows cooling inflation?
Will IREN's pivot to AI cloud computing eventually decouple its stock performance from Bitcoin volatility?
What impact could a sustained rise in oil prices due to geopolitical tensions have on IREN's operational costs?
 16
16





 Create Custom Screeners
  Access 200+ Pre-built Filters
  Use 50+ Readymade Screener





