NewsEarningsRestaurant Brands Asia Reports Compliant QIP Fund Utilization and Revenue Growth in Q1
Restaurant Brands Asia Reports Compliant QIP Fund Utilization and Revenue Growth in Q1


Restaurant Brands Asia (RBA) reported compliant utilization of its INR 500 crore QIP proceeds and solid Q1 financial results. The company used INR 186.67 crore for debt repayment, new restaurant setup, and corporate purposes. Q1 saw a 7.9% increase in consolidated revenue to INR 6,977.23 crore, with India operations growing 12.6%. RBA added 63 new stores in India, bringing the total to 519. The company is focusing on menu innovation, digital transformation, and value leadership to drive growth. RBA aims to open 60-80 new restaurants annually in India, targeting 800 restaurants by FY2029.
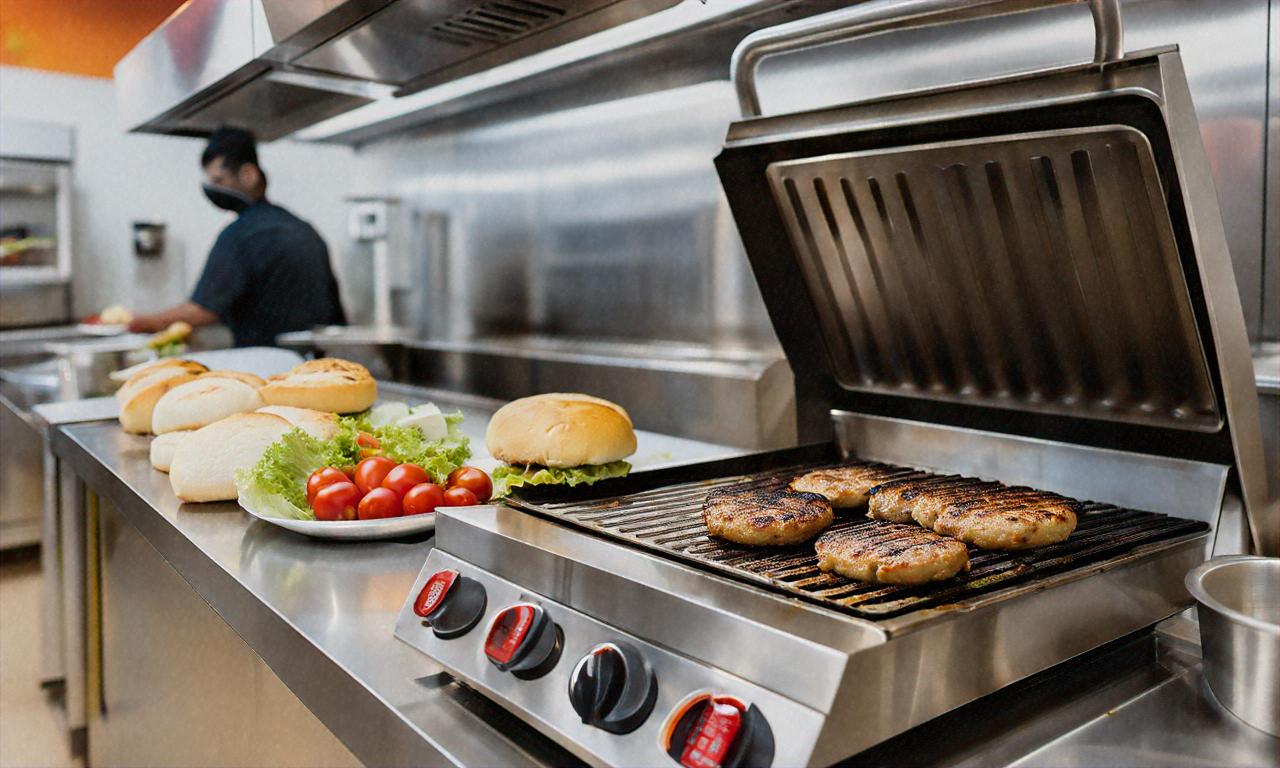
*this image is generated using AI for illustrative purposes only.
Restaurant Brands Asia Limited (RBA), formerly known as Burger King India Limited, has reported compliant utilization of its Qualified Institutions Placement (QIP) proceeds and a solid revenue growth for the first quarter.
QIP Fund Utilization
According to the monitoring agency report submitted for the quarter ended June 30, RBA has shown no deviation from the stated objectives of its INR 500 crore QIP issue. ICRA Limited, the appointed monitoring agency, confirmed that the utilization of funds is in line with the intended purposes.
During the quarter, the company utilized INR 186.67 crore of the QIP proceeds as follows:
| Purpose | Amount (INR Crore) |
|---|---|
| Debt repayment | 72.00 |
| Capital expenditure for new restaurant setup | 30.65 |
| General corporate purposes (primarily salary payments) | 64.11 |
| Issue-related expenses | 19.91 |
The remaining INR 313.33 crore of unutilized funds have been deployed in fixed deposits and mutual funds, generating returns between 7.65% to 9.62%.
Q1 Financial Performance
RBA's financial results for Q1 showcase a strong performance:
- Consolidated revenue from operations increased by 7.9% year-over-year to INR 6,977.23 crore.
- India operations revenue grew by 12.6% to INR 5,522.92 crore.
- Indonesia operations revenue decreased by 6.9% to INR 1,454.31 crore.
India Operations Highlights
- Same-store sales growth of 2.6%
- Addition of 63 new stores over the last year, bringing the total to 519 stores
- Restaurant EBITDA (Pre-IND AS 116) increased by 23.0% year-over-year to INR 536 million
- Company EBITDA (Pre-IND AS 116) grew by 28.6% year-over-year to INR 225 million
Indonesia Operations
- Rationalized portfolio by closing 4 non-performing stores
- Average Daily Sales (ADS) showed improvement, increasing by IDR 1 million every month for the past 9 months
Operational Initiatives
RBA has been focusing on several key initiatives to drive growth:
Menu Innovation: Launched the Korean Spicy Fest to capitalize on the "Hallyu Wave" and introduced new premium offerings like the Whopper Deluxe and BK Fusion range.
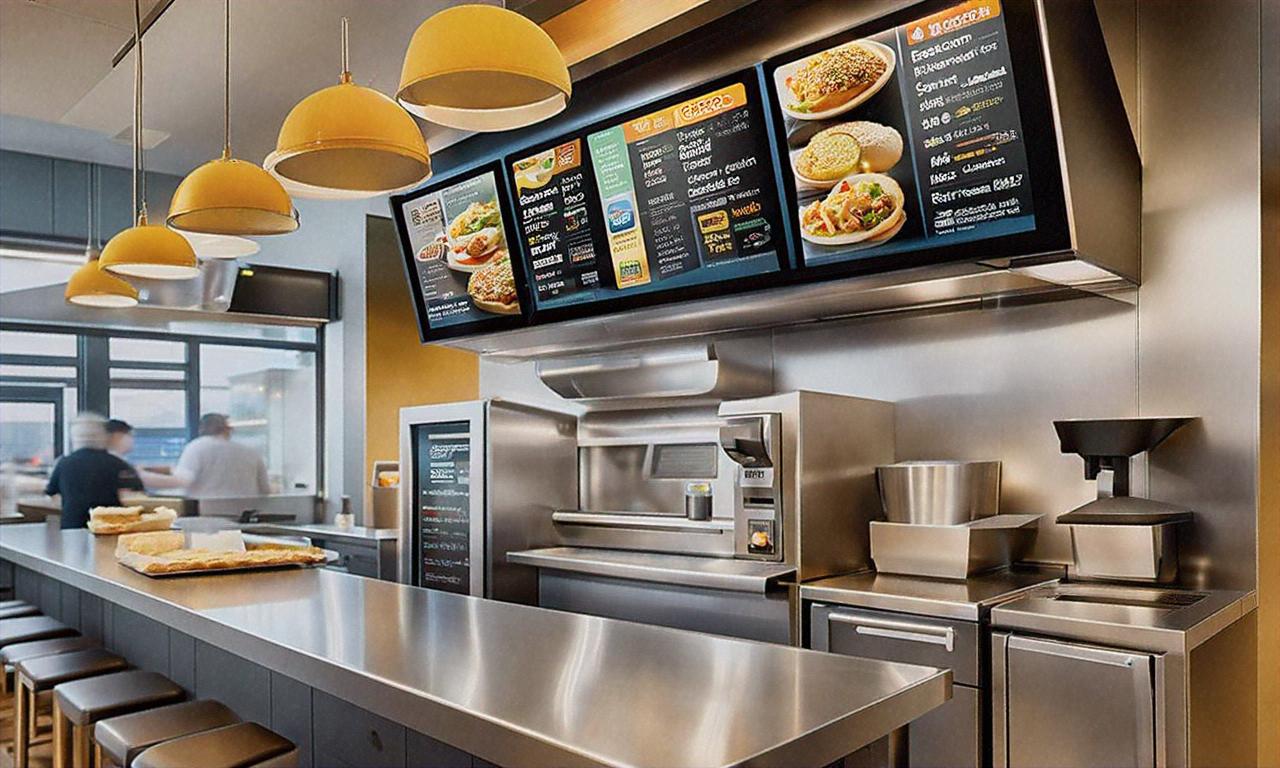
Digital Transformation: Implemented self-ordering kiosks in 484 out of 519 restaurants and introduced table ordering and service in all stores excluding food courts.
Value Leadership: Continued the "2for79" promotion to drive incremental traffic and offered "Crazy App Deals" to increase the frequency of BK App usage.
Indonesia Strategy: Piloting a new fast-casual dining model to improve Average Daily Sales and focusing on strengthening the chicken menu offerings.
Rajeev Varman, Whole-time Director and Group CEO of RBA, commented, "Innovation along with operational excellence has helped us navigate a dynamic environment. Our new Korean range of products have been well received, with guests appreciating the use of premium ingredients and authentic flavours."
Looking ahead, RBA aims to open 60 to 80 new restaurants annually in India, targeting approximately 800 restaurants by FY2029. The company also expects to achieve a gross profit margin of around 70% by FY2029.
As RBA continues to execute its growth strategy and optimize its operations, the company remains focused on creating enduring value for all stakeholders in both the Indian and Indonesian markets.
Historical Stock Returns for Restaurant Brand Asia (Burger King)
| 1 Day | 5 Days | 1 Month | 6 Months | 1 Year | 5 Years |
|---|---|---|---|---|---|
| +0.49% | -9.47% | -10.84% | -2.63% | -33.04% | -47.10% |

 17
17